Blue Excitation: B-3A (Longpass Emission)
The Nikon B-3A fluorescence filter set is equipped with a very broad excitation passband range (70 nanometers), providing a much wider absorption window than any of the other combinations in the blue-excitation series. Ultraviolet, visible, and near-infrared transmission spectral profiles for this longpass emission filter combination are illustrated below in Figure 1. The wide excitation band enables the filter set to be employed with tungsten-halogen illumination, although it is also useful with arc-discharge lamps when investigating probes having very weak signals. The longpass barrier (emission) filter has a cut-on wavelength of 520 nanometers and is capable of transmitting a significant amount of the signal from green, yellow, orange, and red fluorophores that have absorption bands in the blue wavelength region. Similar to the other filter combinations in this class, the B-3A has a longpass dichromatic mirror with a cut-on wavelength of 505 nanometers.
Figure 1 - B-3A (Longpass Emission)
Blue Excitation Filter Block B-3A Specifications
- Excitation Filter Wavelengths: 420-490 nanometers (bandpass, 455 CWL)
- Dichromatic Mirror Cut-on Wavelength: 505 nanometers (longpass, LP)
- Barrier Filter Wavelengths: 520 nanometer cut-on (longpass, LP)
The longpass emission filter contained in the B-3A combination transmits significantly more signal than any of the E-series filter sets, and is comparable to the other longpass (B-1A and B-2A) combinations in the blue-excitation class (with the exception of displaying a much higher noise level). The set is designed to enable the use of tungsten-halogen illumination for fluorochromes excited in the blue spectral region and employs a dichromatic mirror optimized for transmitting fluorescence emission in the green, yellow, orange, and red regions. The 505-nanometer dichromatic mirror cut-on wavelength coupled with the longpass barrier filter (cut-on wavelength of 520 nanometers) is similar to the other blue-excitation filter combinations.
Images produced by the B-3A filter set are very bright (especially with arc-discharge illumination), but have a significantly lower signal-to-noise ratio than images obtained utilizing bandpass emission filters. As a result, the background regions are lighter than those from bandpass emission filters, or in some cases, from other longpass filter combinations (depending upon the illumination source and other factors). Fluorescence emission in the green, yellow, orange, and red regions is often visible in images collected using the B-3Afilter combination (See Figure 2). This set is recommended when investigating the following fluorophores: Acridine Orange, Acridine Red, Alexa Fluor 430, Alexa Fluor 488, chlorophyll (autofluorescence), fluorescein probes, LysoTracker derivatives, phosphine, quinacrine mustard, Sevron probes, and tetracycline. The images presented in Figure 2 demonstrate the performance of this filter combination with a variety of blue absorbing fluorescence probes targeted at different intracellular locations. In general, images generated with the B-3A filter combination exhibit far more background signal than is observed with the other blue excitation sets.
Figure 2 - Nikon B-3A Wide Band Excitation Longpass Filter Set
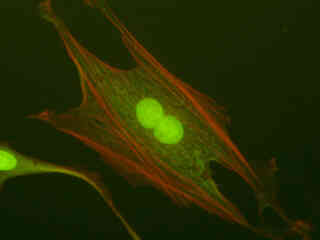
Presented in Figure 2(a) is the fluorescence emission intensity from a culture of rat kangaroo (PtK2) epithelial cells that were immunofluorescently labeled with primary anti-bovine alpha-tubulin mouse monoclonal antibodies followed by goat anti-mouse Fab fragments conjugated to Alexa Fluor 488. The absorption maximum of Alexa Fluor 488 is 495 nanometers and the emission maximum occurs at 519 nanometers. Note the prominent staining of the intracellular microtubular network that extends throughout the cytoplasm and into the midbody between the two daughter cells. In addition, the specimen was simultaneously stained for the nuclear protein cdc6 (conjugated to Pacific Blue), and for F-actin with phalloidin conjugated to Alexa Fluor 568. Note the absence of signal from the blue (Pacific Blue) fluorophore, which is not efficiently excited in this wavelength region. However, a significant amount of signal from the red fluorescent probe (Alexa Fluor 568) can be observed in the cortex.
Fluorescence emission from a thin section of mouse kidney labeled with multiple (3) fluorophores is illustrated in Figure 2(b). Nuclei in the tissue section were targeted with the nucleic acid probe DAPI, which has an excitation maximum at 358 nanometers and an emission maximum at 461 nanometers when bound to DNA in cell cultures and tissue sections. In addition, the cryostat section was also simultaneously stained with Alexa Fluor 488 wheat germ agglutinin (glomeruli and convoluted tubules) and Alexa Fluor 568 phalloidin (filamentous actin and the brush border). Note the absence of signal from the blue (DAPI) fluorophore but the significant level of red (Alexa Fluor 568) fluorescence bleed-through in many regions of the image.
Figures 2(c) and 2(e) depict Indian Muntjac deerskin fibroblast cells labeled with Alexa Fluor 488 (Figure 2(c)) and SYTOX Green (Figure 2(e)). The cells in Figure 2(c) were immunofluorescently labeled with primary anti-oxphos complex V inhibitor protein monoclonal antibodies (mouse) followed by goat anti-mouse Fab fragments conjugated to Alexa Fluor 488. In addition, the specimen was simultaneously stained for F-actin with Alexa Fluor 350 (blue) conjugated to phalloidin, and for DNA with SYTOX Orange. Note the presence of signal from both the orange and green fluorophores, but the absence of any significant emission intensity from Alexa Fluor 350, which is not efficiently excited in the blue wavelength region. In many cases, SYTOX Orange stains a variety of cytoplasmic elements in addition to DNA, as is evident in the image.
SYTOX Green was utilized to stain chromatin in the nuclei of the cells displayed in Figure 2(e). The absorption maximum of SYTOX Green is 504 nanometers and the emission maximum occurs at 523 nanometers. In addition, the specimen was simultaneously labeled with primary anti-human OxPhos Complex V inhibitor protein mouse monoclonal antibodies followed by goat anti-mouse Fab fragments conjugated to Pacific Blue (absorption maximum at 410 nanometers). The actin cytoskeletal network was also labeled with phalloidin conjugated to Alexa Fluor 568. Note the presence of high signal levels from the red (Alexa Fluor 568) fluorophore, but the very weak fluorescence emission intensity from Pacific Blue, which is not efficiently excited in this spectral region.
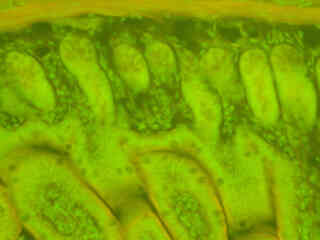
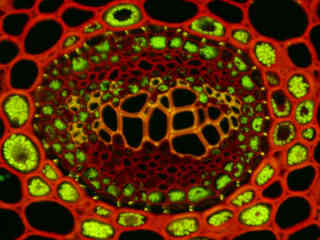
Autofluorescence emission intensity from a thin section of fern rhizome (Cyrtomium falcatum) tissue is presented in Figure 2(f). Endogenous autofluorescence in plant tissues arises from a variety of biomolecules, including chlorophyll, carotene, and xanthophyll. In the blue region, chlorophyll has an absorption band with a high extinction coefficient and produces a significant amount of fluorescence when excited with wavelengths between 420 and 460 nanometers. Note the presence of spectral bleed-through from autofluorescence emission in the yellow and red spectral regions with the B-3A filter combination.
Additional Specimen Images
Rat Kangaroo Cell Cytokinesis
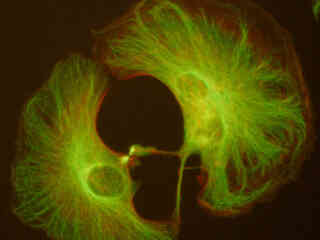
Fluorescence emission intensity from a culture of rat kangaroo (PtK2) epithelial cells that were immunofluorescently labeled with primary anti-bovine alpha-tubulin mouse monoclonal antibodies followed by goat anti-mouse Fab fragments conjugated to Alexa Fluor 488.
Mouse Kidney Tissue
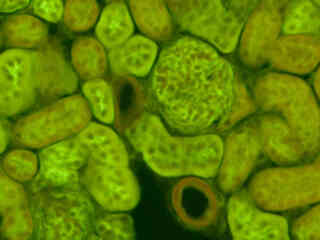
Fluorescence emission intensity from a thin section of mouse kidney labeled with multiple (3) fluorophores.
Indian Muntjac Mitochondria
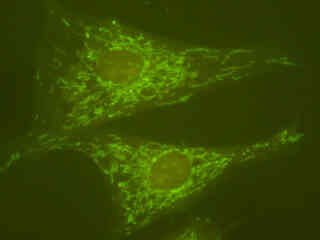
Fluorescence emission intensity from a culture of fibroblast Indian Muntjac deerskin cells that were immunofluorescently labeled with primary anti-oxphos complex V inhibitor protein monoclonal antibodies (mouse) followed by goat anti-mouse Fab fragments conjugated to Alexa Fluor 488.
Mouse Intestine Thin Section
Fluorescence emission intensity from a thin section of mouse intestine stained with Alexa Fluor 350 wheat germ agglutinin, a blue fluorescent lectin that is specific to the mucus of goblet cells.
Contributing Authors
Related Nikon Products
Share this article:


