Blue-Violet Excitation: BV-1A (Longpass Emission)
Ultraviolet, visible, and near-infrared transmission spectral profiles for the Nikon BV-1A filter combination are illustrated below in Figure 1. This set is designed with a very narrow excitation bandpass width of 10 nanometers to minimize autofluorescence. The longpass barrier filter, with cut-on wavelength that is 15 nanometers greater than the dichromatic mirror value, passes all fluorescence wavelengths above 470 nanometers, allowing detection of a broad range of fluorochromes emitting in the blue, green, yellow, orange, and red regions of the visible spectrum.
Figure 1 - BV-1A (Narrow Band Blue-Violet Excitation)
Blue-Violet Excitation Filter Block BV-1A Specifications
- Excitation Filter Wavelengths: 430-440 nanometers (bandpass, 435 CWL)
- Dichromatic Mirror Cut-on Wavelength: 455 nanometers (longpass, LP)
- Barrier Filter Wavelengths: 470 nanometer cut-on (longpass, LP)
The BV-1A fluorescence filter set is designed to perform with a wide range of fluorochromes excited by blue-violet wavelengths, and can be considered a general purpose combination for use where autofluorescence must be limited in comparison to that observed with the standard blue-violet filter block. This filter combination is particularly suited for applications with mercury arc-discharge lamps, which have a prominent spectral line (known as the g-line) at 436 nanometers. For investigations involving living or fixed cells and tissues, the narrow 10-nanometer excitation passband significantly reduces autofluorescence. The BV-1A filter combination is recommended when studying the following fluorophores: aminochloromethoxyacridine (ACMA), acriflavin, Alexa Fluor 430, Astrazon Yellow, atabrine, Calcofluor White, Chromomycin A, chlorotetracycline (CTC), Lucifer Yellow derivatives, quinacrine mustard, and thioflavine S. The images presented in Figure 2 demonstrate the performance of this filter combination with a variety of blue-violet absorbing fluorescence probes targeted at different intracellular locations.
Figure 2 - Nikon BV-1A Blue-Violet Excitation Longpass Filter Set
Illustrated in Figure 2(a) is the fluorescence emission intensity from a culture of bovine pulmonary artery endothelial cells stained with DAPI, which targets DNA in the cell nucleus. The absorption maximum of DAPI (4',6-diamidino-2-phenylindole) is 358 nanometers and the emission maximum occurs at 461 nanometers when the fluorochrome is bound to DNA. The specimen was also simultaneously stained with BODIPY FL phallacidin (targeting actin; green emission) and MitoTracker Red CMXRos (targeting mitochondria; red emission). Note the presence of substantial signal from the green (BODIPY FL) probe, but lower signal levels from the red (MitoTracker) and blue (DAPI) probes. In addition, the nuclei appear far less intense and with fluorescence emission shifted to longer wavelengths than comparable images with the Nikon violet and ultraviolet filter combinations.
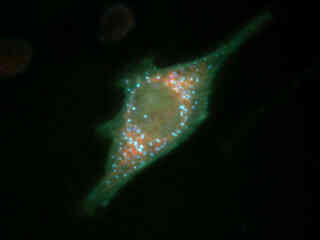
A culture of rat thoracic aorta (muscle) cells that were immunofluorescently labeled with primary anti-oxphos complex V inhibitor protein monoclonal antibodies (mouse) followed by goat anti-mouse Fab fragments conjugated to Pacific Blue is presented in Figure 2(b). The absorption maximum of Pacific Blue is 410 nanometers and the emission maximum occurs at 455 nanometers. In addition, the specimen was simultaneously stained for F-actin with Alexa Fluor 488 (green) conjugated to phalloidin, and for DNA with SYTOX Orange. Note the presence of significant signal from the green fluorophore, which clearly delineates the cytoskeletal actin network. Blue mitochondria are also evident surrounding the nucleus. Fluorescence emission from SYTOX Orange, which is primarily localized in the nucleus, appears green under these observation conditions. In many cases, SYTOX Orange stains a variety of cytoplasmic elements in addition to DNA.
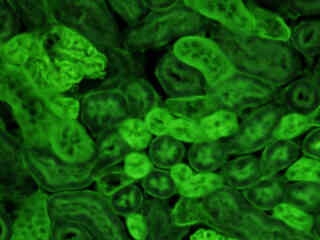
Fluorescence emission intensity from a thin section of mouse intestine stained with a variety of fluorophores, including Alexa Fluor 350, is illustrated in Figure 2(c). The absorption maximum of Alexa Fluor 350 is 346 nanometers and the emission maximum is 442 nanometers. In addition, the specimen was simultaneously stained with Alexa Fluor 568 phalloidin (filamentous actin; 600 nanometer emission) and SYTOX Green (nuclei; 523 nanometer emission). Note the presence of high signal levels from the green fluorophore, but the absence of fluorescence from Alexa Fluor 350 (blue emission), which is not efficiently excited by the BV-1A filter combination. Signal from the red fluorophore (Alexa Fluor 568) is also not observed in this image.
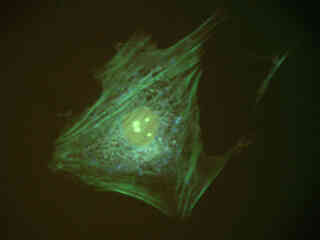
A single rat skeletal muscle tissue cell (L6 cell line; myoblasts) is depicted in Figure 2(d). The cells in this culture were immunofluorescently labeled with primary anti-cdc6 (human) mouse monoclonal antibodies followed by goat anti-mouse Fab fragments conjugated to Marina Blue. The absorption maximum of Marina Blue is 365 nanometers and the emission maximum occurs at 460 nanometers. Cdc6 is expressed in actively replicating cells to function during eukaryotic replication initiation, and is essential for DNA synthesis. The narrow bandpass filter in the BV-1A combination does not efficiently excite Marina Blue, and produces only a weak signal. In addition, the specimen was simultaneously stained for F-actin with Alexa Fluor 488 conjugated to phalloidin, and for mitochondria with MitoTracker Red CMXRos. Note the presence of substantial signal levels from the red (MitoTracker) and green (Alexa Fluor 488) probes.
Illustrated in Figure 2(e) is the emission intensity from a thin section of mouse kidney stained with multiple (3) fluorophores. Nuclei in the tissue section were targeted with the nucleic acid probe DAPI, which has an excitation maximum at 358 nanometers and an emission maximum at 461 nanometers when bound to DNA in cell cultures and tissue sections. In addition, the cryostat section was also simultaneously stained with Alexa Fluor 488 wheat germ agglutinin (glomeruli and convoluted tubules) and Alexa Fluor 568 phalloidin (filamentous actin and the brush border). Note the absence of signal from the red (Alexa Fluor 568) fluorophore, but the significant amount of fluorescence from the green (Alexa Fluor 488) probe. With an ultraviolet excitation longpass emission filter set, the darker nuclei in the specimen, which are devoid of cyan fluorescence emission intensity in Figure 2(e), would appear bright blue.
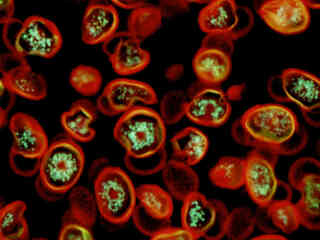
Autofluorescence emission intensity from pine (Pinus taeda) pollen grains is presented in Figure 2(f). Endogenous autofluorescence in plant tissues arises from a variety of biomolecules, including lignins, chlorophyll, carotene, and xanthophyll. In the blue-violet region, chlorophyll has an absorption band with a high extinction coefficient and produces a significant amount of fluorescence when excited with wavelengths between 400 and 440 nanometers. Note the presence of spectral bleed-through from autofluorescence emission in the green and red spectral regions, which is strongly reminiscent of a darkfield image.
Additional Specimen Images with the BV-1A Filter Combination
Bovine Pulmonary Artery Cell Nuclei
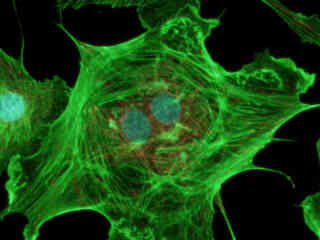
Fluorescence emission intensity from a culture of bovine pulmonary artery endothelial cells stained with DAPI, which targets DNA in the cell nucleus.
Rat Thoracic Aorta Cellular Mitochondria
Fluorescence emission intensity from a culture of rat thoracic aorta (muscle) cells that were immunofluorescently labeled with primary anti-oxphos complex V inhibitor protein monoclonal antibodies (mouse) followed by goat anti-mouse Fab fragments conjugated to Pacific Blue.
Mouse Intestine Thin Section
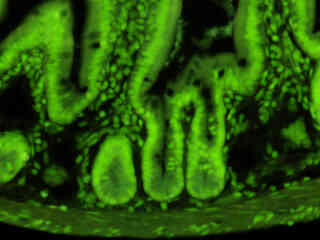
Fluorescence emission intensity from a thin section of mouse intestine stained with Alexa Fluor 350 wheat germ agglutinin, a blue fluorescent lectin that is specific to the mucus of goblet cells.
Rat Skeletal Muscle CDC6
Fluorescence emission intensity from a culture of rat skeletal muscle tissue cells (L6 cell line; myoblasts) that were immunofluorescently labeled with primary anti-cdc6 (human) mouse monoclonal antibodies followed by goat anti-mouse Fab fragments conjugated to Marina Blue.
Contributing Authors
Related Nikon Products
Share this article:


