Blue-Violet Excitation: BV-2B (Longpass Emission)
Ultraviolet, visible, and near-infrared transmission spectral profiles for the Nikon BV-2B filter complement are illustrated below in Figure 1. This filter set is a variation of the BV-2A block, and employs similar components except that each is red-shifted (to a longer wavelength) by 5 nanometers in the center (bandpass) or cut-on (longpass) wavelength. The modified combination results in images with darker backgrounds and higher contrast than those produced with the BV-2A set. The filter combination in the Nikon BV-2B set consists of a medium-width bandpass excitation filter (405-445 nanometers) coupled with a longpass barrier filter (475-nanometer cut-on wavelength) to enable signal collection from a wide range of fluorescent probes. The BV-2B filter set also utilizes a dichromatic mirror with a 460-nanometer cut-on wavelength specification, providing a 15-nanometer separation from the barrier filter cut-on.
Figure 1 - BV-2B (Blue-Violet Excitation)
Blue-Violet Excitation Filter Block BV-2B Specifications
- Excitation Filter Wavelengths: 405-445 nanometers (bandpass, 425 CWL)
- Dichromatic Mirror Cut-on Wavelength: 460 nanometers (longpass, LP)
- Barrier Filter Wavelengths: 475 nanometer cut-on (longpass, LP)
The BV-2B fluorescence filter set is designed to perform with a wide range of fluorochromes excited by blue-violet wavelengths, and is a minor variation of the standard Nikon blue-violet filter block (the BV-2A). By employing a medium-width excitation bandpass in conjunction with a longpass barrier filter, this filter set (along with the BV-2A set) produces the brightest images of the blue-violet group. The BV-2B filter combination is recommended when studying the following fluorophores: aminochloromethoxyacridine (ACMA), acridine homodimer, acriflavin, aminopyrene trisulfate (APTS), Alexa Fluor 430, Astrazon Yellow, atabrine, berberine sulfate, beta-lactamase (non-ratiometric), catecholamine, cyan fluorescent protein (CFP), Calcofluor White, Chromomycin A, chlorotetracycline (CTC), Lucifer Yellow, mithramycin, quinacrine mustard, Sevron Yellow, and thioflavine S. The images presented in Figure 2 demonstrate the performance of this filter combination with a variety of blue-violet absorbing fluorescence probes targeted at different intracellular locations.
Figure 2 - Nikon BV-2B Blue-Violet Excitation Longpass Filter Set
(a)
(b)
(c)
(d)
(e)
(f)
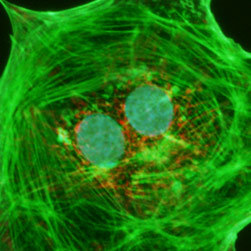
Illustrated in Figure 2(a) is the fluorescence emission intensity from a culture of bovine pulmonary artery endothelial cells stained with DAPI, which targets DNA in the cell nucleus. The absorption maximum of DAPI (4',6-diamidino-2-phenylindole) is 358 nanometers and the emission maximum occurs at 461 nanometers when the fluorochrome is bound to DNA. The specimen was also simultaneously stained with BODIPY FL phallacidin (targeting actin; green emission) and MitoTracker Red CMXRos (targeting mitochondria; red emission). Note the presence of substantial signal from the green (BODIPY FL) probe, but lower signal levels from the red (MitoTracker) and blue (DAPI) probes. In addition, the nuclei appear far less intense and with fluorescence emission shifted to longer wavelengths than comparable images with the Nikon violet and ultraviolet filter combinations.
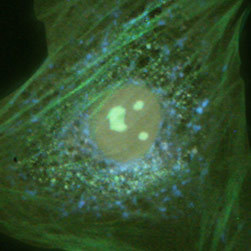
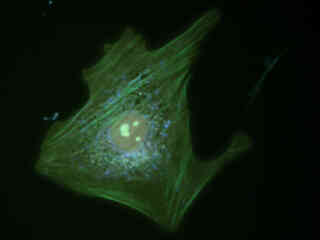
A culture of rat thoracic aorta (muscle) cells that were immunofluorescently labeled with primary anti-oxphos complex V inhibitor protein monoclonal antibodies (mouse) followed by goat anti-mouse Fab fragments conjugated to Pacific Blue is presented in Figure 2(b). The absorption maximum of Pacific Blue is 410 nanometers and the emission maximum occurs at 455 nanometers. In addition, the specimen was simultaneously stained for F-actin with Alexa Fluor 488 (green) conjugated to phalloidin, and for DNA with SYTOX Orange. Note the presence of significant signal from the green fluorophore, which clearly delineates the cytoskeletal actin network. Blue mitochondria are also evident surrounding the nucleus and throughout the cytoplasm. Fluorescence emission from SYTOX Orange, which is primarily localized in the nucleus, appears green under these observation conditions. In many cases, SYTOX Orange stains a variety of cytoplasmic elements in addition to DNA.
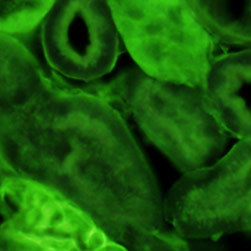
Fluorescence emission intensity from a thin section of mouse kidney stained with multiple (3) fluorophores is demonstrated in Figure 2(c). Nuclei in the tissue section were targeted with the nucleic acid probe DAPI, which has an excitation maximum at 358 nanometers and an emission maximum at 461 nanometers when bound to DNA in cell cultures and tissue sections. In addition, the cryostat section was also simultaneously stained with Alexa Fluor 488 wheat germ agglutinin (glomeruli and convoluted tubules) and Alexa Fluor 568 phalloidin (filamentous actin and the brush border). Note the absence of signal from the red (Alexa Fluor 568) fluorophore, but the significant amount of fluorescence from the green (Alexa Fluor 488) probe.
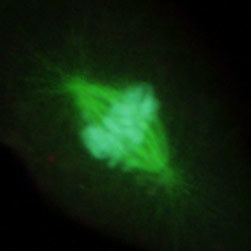
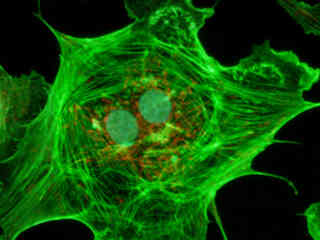
Figure 2(d) illustrates the mitotic spindle apparatus in a dividing cell from a culture of rat kangaroo (PtK2) epithelia that were immunofluorescently labeled with primary anti-bovine alpha-tubulin mouse monoclonal antibodies followed by goat anti-mouse Fab fragments conjugated to Alexa Fluor 488. Note the prominent staining of the intracellular microtubule network that extends throughout the cytoplasm. In addition, the specimen was simultaneously stained for the nuclear protein cdc6 (conjugated to Pacific Blue), and for F-actin with phalloidin conjugated to Alexa Fluor 568. Note the absence of signal from the red (Alexa Fluor 568) fluorophore, but the presence of significant fluorescence emission from the blue (Pacific Blue) and green (Alexa Fluor 488) probes, which clearly define the mitotic spindle apparatus in this image.
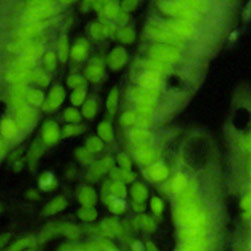
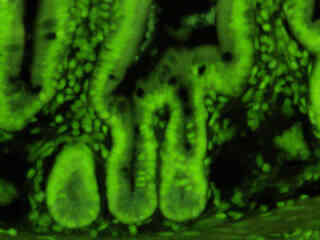
A thin section of mouse intestine stained with Alexa Fluor 350 wheat germ agglutinin, a blue fluorescent lectin that is specific to the mucus of goblet cells is presented in Figure 2(e). The absorption maximum of Alexa Fluor 350 is 346 nanometers and the emission maximum is 442 nanometers. In addition, the specimen was simultaneously stained with Alexa Fluor 568 phalloidin (filamentous actin; 600 nanometer emission) and SYTOX Green (nuclei; 523 nanometer emission). Note the presence of high signal levels from the green fluorophore, but the absence of fluorescence from Alexa Fluor 350 (blue emission), which is not efficiently excited nor detected by the BV-2B filter combination. In many cases, as is evident in the image, SYTOX Green stains other cytoplasmic components in addition to DNA. Signal from the red fluorophore (Alexa Fluor 568) is also not observed in this specimen.
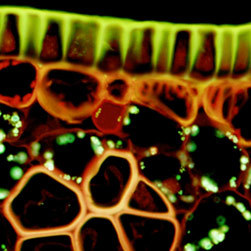
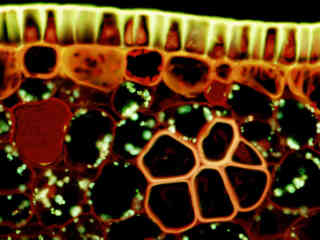
Autofluorescence emission intensity from a palm tree (Cycas pectinata) microsporophyll thin section is shown in Figure 2(f). Endogenous autofluorescence in plant tissues arises from a variety of biomolecules, including lignins, chlorophyll, carotene, and xanthophyll. In the blue-violet region, chlorophyll has an absorption band with a high extinction coefficient and produces a significant amount of fluorescence when excited with wavelengths between 400 and 440 nanometers. Note the presence of autofluorescence emission intensity in the blue, green and red spectral regions, which is strongly reminiscent of a darkfield image.
Additional Specimen Images with the BV-2B Filter Combination
Bovine Pulmonary Artery Cell Nuclei
Fluorescence emission intensity from a culture of bovine pulmonary artery endothelial cells stained with DAPI, which targets DNA in the cell nucleus.
Rat Thoracic Aorta Cellular Mitochondria
Fluorescence emission intensity from a culture of rat thoracic aorta (muscle) cells that were immunofluorescently labeled with primary anti-oxphos complex V inhibitor protein monoclonal antibodies (mouse) followed by goat anti-mouse Fab fragments conjugated to Pacific Blue.
Mouse Kidney Tissue
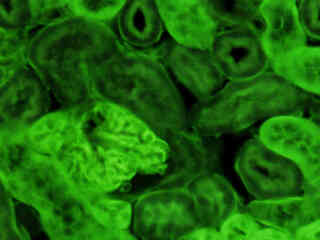
Fluorescence emission intensity from a thin section of mouse kidney stained with multiple (3) fluorophores.
Rat Kangaroo Cell Mitotic Spindle
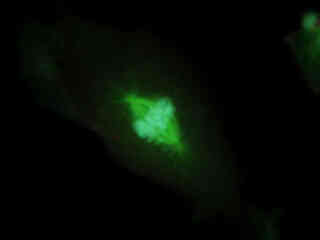
Fluorescence emission intensity from a culture of rat kangaroo (PtK2) epithelial cells that were immunofluorescently labeled with primary anti-bovine alpha-tubulin mouse monoclonal antibodies followed by goat anti-mouse Fab fragments conjugated to Alexa Fluor 488.
Contributing Authors
Related Nikon Products
Share this article:


