Violet Excitation: V-2A (Longpass Emission)
Ultraviolet and visible transmission spectral profiles for the Nikon V-2A filter complement are illustrated below in Figure 1. This combination, consisting of a medium-width excitation bandpass filter (380-420 nanometers) with a longpass (450-nanometer cut-on) barrier filter, enables signal detection from a wide array of fluorochromes. The dichromatic mirror utilized in the V-2A set has the same 430-nanometer cut-on wavelength specification as the V-1A filter block, resulting in a 20-nanometer separation wavelength from the barrier filter cut-on.
Figure 1 - V-2A (Standard Violet Excitation)
Violet Excitation Filter Block V-2A Specifications:
- Excitation Filter Wavelengths: 380-420 nanometers (bandpass, 400 CWL)
- Dichromatic Mirror Cut-on Wavelength: 430 nanometers (longpass, LP)
- Barrier Filter Wavelengths: 450 nanometer cut-on (longpass, LP)
The V-2A filter combination is the standard Nikon set for violet excitation wavelengths, and is applicable to a wide range of fluorochromes. With an excitation bandpass (380-420 nanometers) that essentially spans the entire violet spectral region, this filter combination produces the brightest images of the violet filter group. The V-2A filter combination is recommended when studying the following fluorophores: beta-lactamase (non-ratiometric), Cascade yellow, catecholamine, CCF2 (GeneBLAzer), dapoxyl, formaldehyde induced fluorescence, gloxalic acid, Hoechst 34580, hydroxypyrene trisulfonic acid (HPTS), hydroxytryptamine (HAT), Pacific Blue, pyronine, serotonin, Spectrum Blue, tetracycline, and uranine B. The images presented in Figure 2 demonstrate the performance of the V-2A filter combination with a variety of violet absorbing fluorescence probes targeted at different intracellular locations.
Figure 2 - Nikon V-2A Medium Band Violet Excitation Longpass Filter Set
Illustrated in Figure 2(a) is a pair of rat skeletal muscle (myocytes) daughter cells that were immunofluorescently labeled with primary anti-human cdc6 (a nuclear protein) mouse monoclonal antibodies followed by goat anti-mouse Fab fragments conjugated to Marina Blue. The specimen was simultaneously stained for F-actin with Alexa Fluor 488 (green) conjugated to phalloidin, and for mitochondria with MitoTracker Red CMXRos. Note the weak signal from Marina Blue (the fluorophore is not particularly efficient for violet excitation) and the presence of signal from both the red and green fluorophores.
Figure 2(b) demonstrates the emission profile from a culture of Indian Muntjac deerskin cells that were immunofluorescently labeled with primary anti-bovine alpha-tubulin mouse monoclonal antibodies followed by goat anti-mouse Fab fragments conjugated to Pacific Blue. The absorption maximum of Pacific Blue is 410 nanometers and the emission maximum occurs at 455 nanometers. Note the prominent staining of the intracellular microtubular network that extends throughout the cytoplasm. A thick section of mouse intestine, labeled with Alexa Fluor 350, is presented in Figure 2(c). This fluorophore, which has an excitation maximum at 346 with a corresponding emission peak at 442 nanometers, does not absorb violet light with the high degree of efficiency demonstrated by several of the other specimens in Figure 2.
A culture of rat thoracic aorta (muscle) cells that were immunofluorescently labeled with primary anti-desmin (an intermediate filament protein) mouse monoclonal antibodies followed by goat anti-mouse Fab fragments conjugated to Pacific Blue is illustrated in Figure 2(d). In addition, the specimen was simultaneously stained with Alexa Fluor 568 (red) conjugated to phalloidin, and for DNA with SYTOX Green. Note the presence of signal from both the red and green fluorophores. In many cases, SYTOX Green stains a variety of cytoplasmic elements in addition to DNA, as is evident in the image.
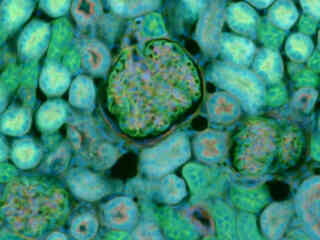
Illustrated in Figure 2(e) is the fluorescence emission intensity from a thin section of mouse kidney stained with DAPI, Alexa Fluor 488 wheat germ agglutinin, a green fluorescent lectin that is specific to the glomeruli and convoluted tubules. The absorption maximum of DAPI is 358 nanometers and the emission maximum is 461 nanometers. In addition, the specimen was simultaneously stained with Alexa Fluor 568 phalloidin (filamentous actin). Note the presence of spectral bleed-through from the red and green fluorophores, which appears throughout the image.
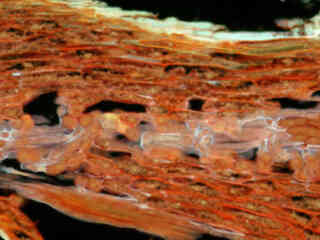
Autofluorescence in plant tissues (fern tissue section) is represented in Figure 2(f), and demonstrates the wide emission spectrum of endogenous fluorophores in these specimens. In the violet region, chlorophyll has an absorption band with a high extinction coefficient and produces a significant amount of fluorescence when excited with wavelengths between 390 and 420 nanometers. Note the presence of spectral bleed-through from autofluorescence emission in the green and red spectral regions, which is strongly reminiscent of a darkfield image. In most cases, images captured with the V-2A filter combination exhibit more background fluorescence than the blue fluorescent protein (BFP) bandpass set and the V-1Alongpass filter combination.
Additional Specimen Images with the V-2A Filter Combination
Rat Skeletal Muscle Cells
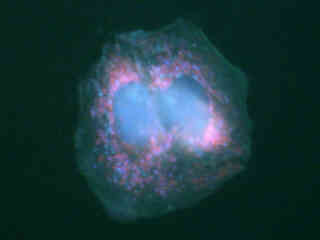
Fluorescence emission intensity from a pair of rat skeletal muscle (myocytes) daughter cells that were immunofluorescently labeled with primary anti-human cdc6 (a nuclear protein) mouse monoclonal antibodies followed by goat anti-mouse Fab fragments conjugated to Marina Blue.
Indian Muntjac Tubulin
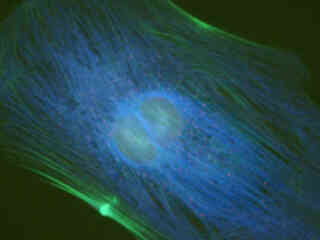
Fluorescence emission intensity from a culture of fibroblast Indian Muntjac deerskin cells that were immunofluorescently labeled with primary anti-bovine alpha-tubulin mouse monoclonal antibodies followed by goat anti-mouse Fab fragments conjugated to Pacific Blue.
Mouse Intestine Thin Section
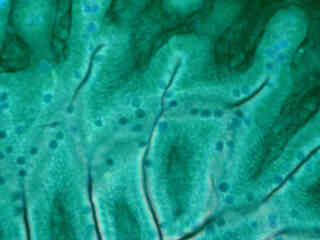
Fluorescence emission intensity from a thin section of mouse intestine stained with Alexa Fluor 350 wheat germ agglutinin, a blue fluorescent lectin that is specific to the mucus of goblet cells.
Rat Thoracic Aorta Cellular Mitochondria
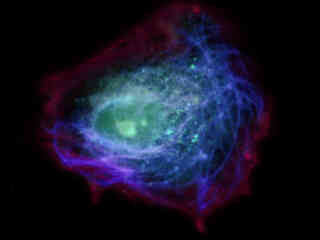
Fluorescence emission intensity from a culture of rat thoracic aorta (muscle) cells that were immunofluorescently labeled with primary anti-desmin (an intermediate filament protein) mouse monoclonal antibodies followed by goat anti-mouse Fab fragments conjugated to Pacific Blue.
Contributing Authors
Related Nikon Products
Share this article:


