Dual Band Excitation: DAPI-FITC
The Nikon dual excitation band DAPI-FITC filter set is designed for the simultaneous detection of the popular fluorophores DAPI and FITC (fluorescein isothiocyanate) when applied in combination, and incorporates an excitation filter with narrow bandpass windows in the violet (400-418 nanometers) and the blue (478-495 nanometers) spectral regions. Ultraviolet and visible transmission spectral profiles for the Nikon DAPI-FITC filter combination are illustrated below in Figure 1. Dual emission (barrier) filter bandpass regions, incorporated into a single filter, allow detection of blue and green emission from the two fluorochromes simultaneously while minimizing spectral crossover between the probes. Sharp transitions between transmission and reflection bands for each filter, and the application of a dichromatic mirror having two bandpass transmission regions (polychromatic; chosen to be complementary to the emission and excitation wavelengths), permit dual-band signal detection with minimal interference.
Figure 1 - DAPI-FITC Dual Band Excitation
Dual Excitation Filter Block DAPI-FITC Specifications
- Excitation Filter Wavelengths: 400-418 nanometers (bandpass, 409 CWL) and 478-495 nanometers (bandpass, 487 CWL)
- Polychromatic Mirror Wavelengths: 435-470 nanometers (bandpass) and 505-570 nanometers (bandpass)
- Barrier Filter Wavelengths: 450-465 nanometers (bandpass, 458 CWL) and 510-555 nanometers (bandpass, 533 CWL)
The DAPI-FITC dual band fluorescence filter combination is designed specifically for simultaneous detection of the fluorochromes DAPI and FITC with minimal crosstalk between bands, and can be employed with other pairs of fluorescent probes having similar spectral profiles. The shorter-wavelength signal channel of the filter set selects narrowly defined spectral regions for violet excitation and blue emission detection, while the longer-wavelength component corresponds to blue excitation and green emission detection. The short-wavelength excitation passband transmission profile is deliberately reduced to provide better balance with the blue-excited fluorochrome signal. This filter set is recommended when studying various combinations of the following fluorophores: DAPI, blue fluorescent protein (BFP), or Hoechst dyes (violet excitation), paired with FITC, green fluorescent protein (GFP), Cy2, or Alexa Fluor 488 (blue excitation). The images presented in Figure 2 demonstrate the performance of this filter combination with a variety of fluorescence probe pairs targeted at different intracellular locations.
Figure 2 - Nikon DAPI-FITC Dual Excitation Filter Set
Illustrated in Figure 2(a) is the fluorescence emission profile using the DAPI-FITC filter block and a culture of Indian Muntjac deerskin fibroblast cells stained with Alexa Fluor 488 conjugated to phalloidin, which binds to the intracellular filamentous actin network. The visible light absorption maximum of Alexa Fluor 488 is 495 nanometers and the emission maximum occurs at 519 nanometers in the green region of the spectrum. In addition, the specimen was simultaneously stained with DAPI (targeting DNA in the cell nucleus; excitation at 358 nanometers and emission at 461 nanometers) and MitoTracker Red CMXRos (targeting mitochondria; red emission). Note the absence of signal from the red fluorophore (MitoTracker), but the presence of bright green fluorescence exhibited by the actin filaments and the slightly lower intensity blue signal from DAPI in the cell nucleus.
A thin section of mouse intestine stained with Alexa Fluor 350 wheat germ agglutinin, a blue fluorescent lectin that is specific to the mucus of goblet cells, is presented in Figure 2(b). In addition, the specimen was simultaneously stained with Alexa Fluor 568 phalloidin (filamentous actin; 600 nanometer emission) and SYTOX Green (nuclei; 504 nanometer excitation and 523 nanometer emission). Note the low signal level from the blue fluorophore (Alexa Fluor 350), but the bright green fluorescence of nuclei in the tissue specimen due to SYTOX Green fluorescence. This dual excitation filter combination effectively eliminates signal from the red (Alexa Fluor 568) probe.
Figure 2(c) demonstrates the fluorescence emission intensity from a culture of rat kangaroo (PtK2) epithelial cells that were immunofluorescently labeled with primary anti-bovine alpha-tubulin mouse monoclonal antibodies followed by goat anti-mouse Fab fragments conjugated to Alexa Fluor 488. In addition, the specimen was labeled with Hoechst 33258, which selectively binds to DNA in the cell nucleus, and MitoTracker Red CMXRos (targeting mitochondria; red fluorescence). Note the prominent green staining of the intracellular microtubule network that extends throughout the cytoplasm, and the blue emission from Hoechst 33258 bound to DNA in the nucleus. The cell in the lower portion of the image appears to be undergoing mitosis in the prometaphase or metaphase state.
Swiss mouse (3T3 line) cells immunofluorescently labeled with primary anti-cytochrome oxidase mouse monoclonal antibodies followed by goat anti-mouse Fab fragments conjugated to Alexa Fluor 568 are illustrated in Figure 2(d). The specimen was also labeled with several additional probes, including lectin Helix pomatia agglutinin (HPA) conjugated to Alexa Fluor 488 (green emission), which selectively binds to glycoproteins in the Golgi apparatus in this cell line. Cytoskeletal actin filaments were stained with Alexa Fluor 680 (red excitation; near-infrared emission) and the nuclear DNA was labeled with DAPI (blue emission). Note the prominent green staining of the Golgi apparatus and the blue fluorescence intensity observed in the nuclei.
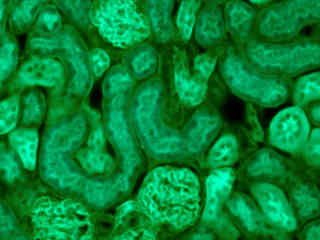
Fluorescence emission from a thin section of mouse kidney stained with multiple (3) fluorophores is presented in Figure 2(e). Nuclei in the tissue section were targeted with the nucleic acid probe DAPI, which has an excitation maximum at 358 nanometers and an emission maximum at 461 nanometers when bound to DNA in cell cultures and tissue sections. In addition, the cryostat section was also simultaneously stained with Alexa Fluor 488 wheat germ agglutinin (glomeruli and convoluted tubules) and Alexa Fluor 568 phalloidin (filamentous actin and the brush border). Note the presence of signal from both the blue (DAPI) and green (Alexa Fluor 488) probes, but the absence of orange-red fluorescence due to Alexa Fluor 568 conjugates in the actin and brush border networks.
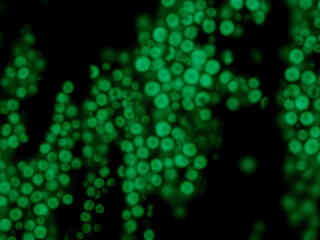
Autofluorescence emission from a corn kernel (Zea mays) thin section is demonstrated in Figure 2(f). Endogenous autofluorescence in plant tissues arises from a variety of biomolecules, including chlorophyll, carotene, and xanthophyll. In the ultraviolet and blue excitation regions, chlorophyll has an absorption band with a high extinction coefficient and produces a significant amount of fluorescence when excited with wavelengths between 350 and 500 nanometers. For the corn kernel tissue illustrated above, note the presence of autofluorescence emission intensity in the blue and green spectral regions, which is characteristic of the Nikon DAPI-FITC fluorescence filter combination.
Additional Specimen Images with the DAPI-FITC Filter Combination
Indian Muntjac Cell Actin Cytoskeleton
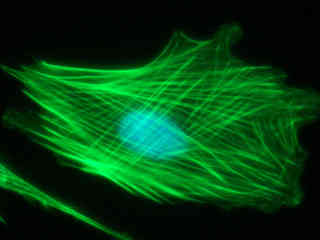
Fluorescence emission intensity from a culture of Indian Muntjac deerskin fibroblast cells stained with Alexa Fluor 488 conjugated to phalloidin, which binds to the intracellular filamentous actin network.
Mouse Intestine Thin Section
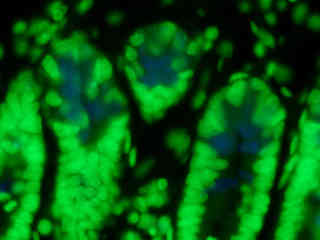
Fluorescence emission intensity from a thin section of mouse intestine stained with Alexa Fluor 350 wheat germ agglutinin, a blue fluorescent lectin that is specific to the mucus of goblet cells. In addition, the specimen was simultaneously stained with Alexa Fluor 568 phalloidin (filamentous actin; 600 nanometer emission) and SYTOX Green (nuclei; 504 nanometer excitation and 523 nanometer emission).
Rat Kangaroo Cell DNA and Tubulin
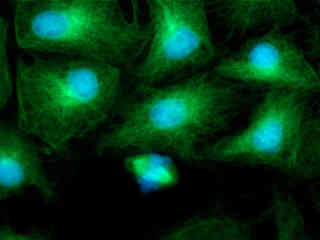
Fluorescence emission intensity from a culture of rat kangaroo (PtK2) epithelial cells that were immunofluorescently labeled with primary anti-bovine alpha-tubulin mouse monoclonal antibodies followed by goat anti-mouse Fab fragments conjugated to Alexa Fluor 488.
Swiss Mouse (3T3) Cells with DAPI and Alexa Fluor 488
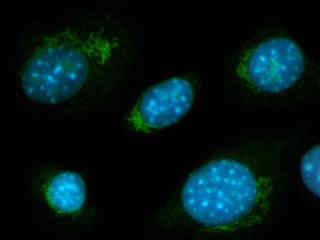
Fluorescence emission intensity from a culture of Swiss mouse (3T3 line) cells that were immunofluorescently labeled with primary anti-cytochrome oxidase mouse monoclonal antibodies followed by goat anti-mouse Fab fragments conjugated to Alexa Fluor 568.
Contributing Authors
Related Nikon Products
Share this article:


