Dual Band Excitation: FITC-TRITC
Ultraviolet and visible transmission spectral profiles for the Nikon dual band excitation and emission FITC-TRITC filter combination are illustrated below in Figure 1. This filter set is designed for optimal detection of the traditional fluorescein isothiocyanate (FITC) and tetramethylrhodamine isothiocyanate (TRITC) probes in combination, as well as other fluorophores with similar absorption and emission spectra. The dual excitation interference filter incorporates an excitation filter with narrow passband windows in the blue (475 to 490 nanometers) and the green (540 to 565 nanometers) spectral regions. Dual emission (barrier) filter bandpass regions enable detection of green and orange-red emission from the two fluorochromes simultaneously. Sharp transitions between transmission and reflection bands of each filter, and application of a dichromatic mirror having two bandpass transmission regions (polychromatic) chosen to be complementary to the emission and excitation wavelengths, permit dual-band signal detection with minimal interference.
Figure 1 - FITC-TRITC Dual Band Excitation
Dual Excitation Filter Block FITC-TRITC Specifications
- Excitation Filter Wavelengths: 475-490 nanometers (bandpass, 483 CWL) and 540-565 nanometers (bandpass, 553 CWL)
- Polychromatic Mirror Wavelengths: 500-540 nanometers (bandpass) and 575-660 nanometers (bandpass)
- Barrier Filter Wavelengths: 503-530 nanometers (bandpass, 517 CWL) and 580-620 nanometers (bandpass, 600 CWL)
The FITC-TRITC dual band fluorescence filter combination is designed specifically for simultaneous detection of the fluorochromes FITC and TRITC with minimal crosstalk between bands, and can be employed with other pairs of fluorescent probes having similar spectral profiles. When specimens are illuminated with a mercury arc-discharge lamp, the 546-nanometer line is ideal for TRITC excitation. The shorter wavelength signal channel of the filter set selects narrowly defined spectral regions for blue excitation and green emission detection, while the longer wavelength component corresponds to green excitation and orange-red emission detection. This filter set is recommended when studying various combinations of the following fluorophores: FITC, green fluorescent proteins (GFP andEGFP), Cy2, or Alexa Fluor 488 (blue excitation), paired with TRITC, Cy3, red fluorescent protein (DsRed), or Alexa Fluor 546 and 568 (green excitation). The images presented in Figure 2 demonstrate the performance of this filter combination with a variety of fluorescence probe pairs targeted at different intracellular locations.
Figure 2 - Nikon FITC-TRITC Dual Excitation Filter Set
Illustrated in Figure 2(a) is the fluorescence emission intensity from a culture of bovine pulmonary artery endothelial cells stained with MitoTracker Red CMXRos and BODIPY FL phallacidin, which target the intracellular mitochondrial network and cytoskeletal actin filaments, respectively. The absorption maximum of MitoTracker Red CMXRos is 579 nanometers and the emission maximum occurs at 599 nanometers, while the corresponding values for BODIPY FL are 503 and 512 nanometers. In addition, the specimen was simultaneously stained with DAPI (targeting DNA in the cell nucleus; blue emission). Note the absence of signal from the blue (DAPI) fluorophore, but the bright yellow-orange fluorescence exhibited by the tubular mitochondria, and the green emission from actin filaments in the cytoplasm.
A thin section of mouse intestine stained with Alexa Fluor 350 wheat germ agglutinin, a blue fluorescent lectin that is specific to the mucus of goblet cells is presented in Figure 2(b). In addition, the specimen was simultaneously stained with Alexa Fluor 568 phalloidin (filamentous actin; 600 nanometer emission) and SYTOX Green (nuclei; 504 nanometer excitation and 523 nanometer emission). Note the absence of signal from the blue fluorophore (Alexa Fluor 350), but the bright green fluorescence of nuclei in the tissue specimen due to SYTOX Green, and the orange-red fluorescence from actin in the brush border.
Figure 2(c) demonstrates fluorescence emission in a culture of Chinese hamster ovary (CHO line) cells that were transfected with an enhanced green fluorescent protein (EGFP) vector containing complementary DNA to Thy-1, a small glycoprotein residing in the Golgi apparatus. This cell line expresses EGFP-Thy-1 chimeric proteins that are primarily localized to the Golgi, but also distributed into vesicles throughout the cytoplasm. The specimen was labeled with several additional probes, including MitoTracker Red CMXRos (targeting the mitochondria; red fluorescence) and DAPI (targeting the nuclei; blue fluorescence). Note the prominent green staining of the Golgi apparatus in the areas surrounding the nucleus, which is devoid of blue fluorescence from DAPI with this filter combination. Vesicles in the cytoplasm also exhibit green fluorescence, but to a much lesser degree than that seen in the Golgi. In addition, orange-red fluorescence arising from the MitoTracker dye is clearly visible in the mitochondrial network.
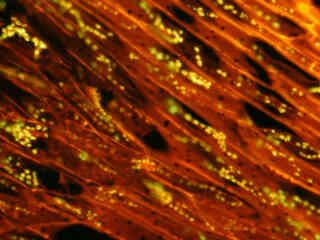
Fluorescence in a thin section of mouse kidney stained with multiple (3) fluorophores is presented in Figure 2(d). Nuclei in the tissue section were targeted with the nucleic acid probe DAPI, which has an excitation maximum at 358 nanometers and an emission maximum at 461 nanometers when bound to DNA in cell cultures and tissue sections. In addition, the cryostat section was also simultaneously stained with Alexa Fluor 488 wheat germ agglutinin (glomeruli and convoluted tubules; 519-nanometer emission) and Alexa Fluor 568 phalloidin (filamentous actin and the brush border). Note the presence of signal from both the green (Alexa Fluor 488) and red (Alexa Fluor 568) probes, but the absence of blue fluorescence due to DAPI, which is suppressed by this filter combination.
A culture of bovine pulmonary artery endothelial cells that were immunofluorescently labeled with primary anti-bovine alpha-tubulin mouse monoclonal antibodies followed by goat anti-mouse Fab fragments conjugated to BODIPY FL is depicted in Figure 2(e). The cell culture was simultaneously stained with Texas Red phalloidin and DAPI, which target the cytoskeletal actin network and DNA in the nucleus, respectively. The absorption maximum of BODIPY FL is 505 nanometers and the emission maximum occurs at 513 nanometers, while the corresponding values for Texas Red are 595 and 620 nanometers. Note the absence of signal from the blue (DAPI) fluorophore, but the bright red fluorescence exhibited by the actin filaments in the cytoplasm and the green emission from the microtubule network.
Autofluorescence emission intensity from a club moss strobilus (Lycopodium clavatum) thin section is demonstrated in Figure 2(f). Endogenous autofluorescence in plant tissues arises from a variety of biomolecules, including chlorophyll, carotene, and xanthophyll. In the blue and green excitation regions, chlorophyll has an absorption band with a high extinction coefficient and produces a significant amount of fluorescence when excited with wavelengths between 450 and 550 nanometers. For the club moss tissue illustrated above, note the presence of autofluorescence emission intensity in the green and red spectral regions, which is characteristic of the Nikon FITC-TRITC fluorescence filter combination.
Additional Specimen Images with the FITC-TRITC Filter Combination
Bovine Pulmonary Artery Cell Mitochondria and Actin
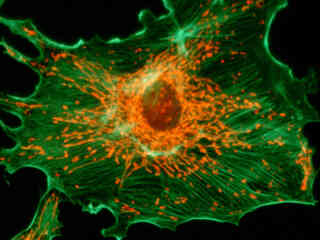
Fluorescence emission intensity from a culture of bovine pulmonary artery endothelial cells stained with MitoTracker Red CMXRos and BODIPY FL phallacidin, which target the intracellular mitochondrial network and cytoskeletal actin filaments, respectively.
Mouse Intestine Thin Section
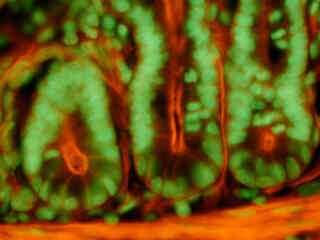
Fluorescence emission intensity from a thin section of mouse intestine stained with Alexa Fluor 350 wheat germ agglutinin, a blue fluorescent lectin that is specific to the mucus of goblet cells.
Chinese Hamster Ovary Cells with EGFP and MitoTracker Red CMXRos
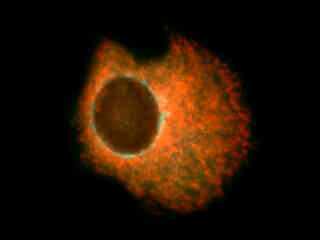
Fluorescence emission intensity from a culture of Chinese hamster ovary (CHO line) cells that were transfected with an enhanced green fluorescent protein (EGFP) vector containing complementary DNA to Thy-1, a small glycoprotein residing in the Golgi apparatus.
Mouse Kidney Tissue
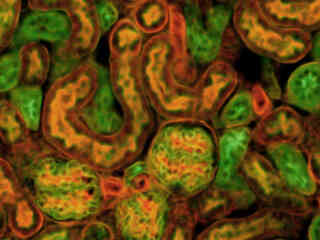
Fluorescence emission intensity from a thin section of mouse kidney stained with multiple (3) fluorophores.
Bovine Pulmonary Artery Cell Actin and Tubulin
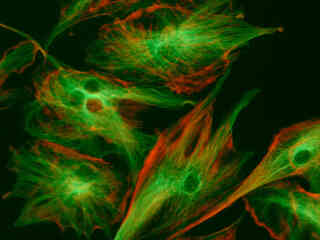
Fluorescence emission intensity from a culture of bovine pulmonary artery endothelial cells that were immunofluorescently labeled with primary anti-bovine alpha-tubulin mouse monoclonal antibodies followed by goat anti-mouse Fab fragments conjugated to BODIPY FL.
Contributing Authors
Related Nikon Products
Share this article:


