Blue Excitation: B-2A (Longpass Emission)
The Nikon B-2A fluorescence filter set is designed to provide an expanded absorption window for fluorophores, when compared to the B-1A combination, by utilizing a medium sized bandpass excitation filter (40 nanometers) rather than a narrow excitation passband. Ultraviolet, visible, and near-infrared transmission spectral profiles for the Nikon B-2A filter combination are illustrated below in Figure 1. The longpass barrier (emission) filter has a cut-on wavelength of 515 nanometers and is capable of transmitting a significant amount of the signal from green, yellow, and red fluorophores that have absorption bands in the central blue wavelength region. In addition, the B-2A combination employs a longpass dichromatic mirror with a cut-on wavelength of 500 nanometers, 5 nanometers below that of other filter sets in the blue-excitation series.
Figure 1 - B-1A (Medium Band Blue Excitation)
Blue Excitation Filter Block B-2A Specifications
- Excitation Filter Wavelengths: 450-490 nanometers (bandpass, 470 CWL)
- Dichromatic Mirror Cut-on Wavelength: 500 nanometers (longpass, LP)
- Barrier Filter Wavelengths: 515 nanometer cut-on (longpass, LP)
Images produced by the B-2A filter combination are brighter, but have a lower signal-to-noise ratio than their bandpass counterparts, typically resulting in lighter background areas compared to images acquired with the bandpass emission filter sets. Fluorescence emission in the yellow, orange, and red regions is often visible in images collected using the B-2A filter combination (as illustrated in Figure 2). This set is recommended when investigating the following fluorophores: fluorescein isothiocyanate (FITC), Acridine Orange, Acridine Yellow, Alexa Fluor 488, Auramine O, BOBO-1, BO-PRO-1, Calcein, Coriphosphine O, BODIPY FL, Fluo-3, green fluorescent protein (GFP; and red-shifted variants), oxacarbocyanine dyes (such as DiO), SYTO, and SYTOX Green. The images presented in Figure 2 demonstrate the performance of this filter combination with a variety of blue absorbing fluorescence probes targeted at different intracellular locations.
Images produced by the B-2A filter combination are brighter, but have a lower signal-to-noise ratio than their bandpass counterparts, typically resulting in lighter background areas compared to images acquired with the bandpass emission filter sets. Fluorescence emission in the yellow, orange, and red regions is often visible in images collected using the B-2A filter combination (as illustrated in Figure 2). This set is recommended when investigating the following fluorophores: fluorescein isothiocyanate (FITC), Acridine Orange, Acridine Yellow, Alexa Fluor 488, Auramine O, BOBO-1, BO-PRO-1, Calcein, Coriphosphine O, BODIPY FL, Fluo-3, green fluorescent protein (GFP; and red-shifted variants), oxacarbocyanine dyes (such as DiO), SYTO, and SYTOX Green. The images presented in Figure 2 demonstrate the performance of this filter combination with a variety of blue absorbing fluorescence probes targeted at different intracellular locations.
Figure 2 - Nikon B-2A Medium Band Blue Excitation Longpass Filter Set
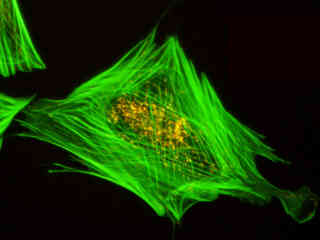
Illustrated in Figure 2(a) is the fluorescence emission intensity from a culture of rat kangaroo (PtK2) epithelial cells that were immunofluorescently labeled with primary anti-bovine alpha-tubulin mouse monoclonal antibodies followed by goat anti-mouse Fab fragments conjugated to Alexa Fluor 488. The absorption maximum of Alexa Fluor 488 is 495 nanometers and the emission maximum occurs at 519 nanometers. Note the prominent staining of the intracellular microtubular network that extends throughout the cytoplasm and into the midbody between the two daughter cells. In addition, the specimen was simultaneously stained for the nuclear protein cdc6 (conjugated to Pacific Blue), and for F-actin with phalloidin conjugated to Alexa Fluor 568. Note the absence of signal from the blue (Pacific Blue) fluorophore, which is not efficiently excited in this wavelength region. However, a low level of signal from the red fluorescent probe (Alexa Fluor 568) can be observed in the cortex.
Fluorescence emission from a thin section of mouse kidney labeled with multiple (3) fluorophores is illustrated in Figure 2(b). Nuclei in the tissue section were targeted with the nucleic acid probe DAPI, which has an excitation maximum at 358 nanometers and an emission maximum at 461 nanometers when bound to DNA in cell cultures and tissue sections. In addition, the cryostat section was also simultaneously stained with Alexa Fluor 488 wheat germ agglutinin (glomeruli and convoluted tubules) and Alexa Fluor 568 phalloidin (filamentous actin and the brush border). Note the absence of signal from the blue (DAPI) fluorophore but the low level of red (Alexa Fluor 568) fluorescence bleed-through in many regions of the image.
Figure 2(c) demonstrates the performance of the B-2A filter combination using a culture of Indian Muntjac cells that were labeled with SYTOX Green to stain chromatin in the nuclei. The absorption maximum of SYTOX Green is 504 nanometers and the emission maximum occurs at 523 nanometers. In addition, the specimen was simultaneously labeled with primary anti-human OxPhos Complex V inhibitor protein mouse monoclonal antibodies followed by goat anti-mouse Fab fragments conjugated to Pacific Blue (absorption maximum at 410 nanometers). The actin cytoskeletal network was also labeled with phalloidin conjugated to Alexa Fluor 568. Note the presence of weak signal levels from the red (Alexa Fluor 568) fluorophore. Indian Muntjac cells labeled with Alexa Fluor 488 conjugated to phalloidin (staining actin filaments for green fluorescence) are illustrated in Figure 2(e). The specimen was also stained for mitochondria with Alexa Fluor 555 (visible as orange emission in the image) using the immunofluorescent methodology described above.
Illustrated in Figure 2(d) are HeLa epithelial cells that were immunofluorescently labeled with primary anti-oxphos complex V inhibitor protein monoclonal antibodies (mouse) followed by goat anti-mouse Fab fragments conjugated to Alexa Fluor 488. The absorption maximum of Alexa Fluor 488 is 495 nanometers and the emission maximum occurs at 519 nanometers. In addition, the specimen was simultaneously stained for F-actin with Alexa Fluor 568 (red) conjugated to phalloidin, and for DNA with 4',6-diamidino-2-phenylindole (DAPI). Note the presence of signal from both the red and green fluorophores, but the absence of any significant emission intensity from DAPI, which is not efficiently excited in the blue wavelength region.
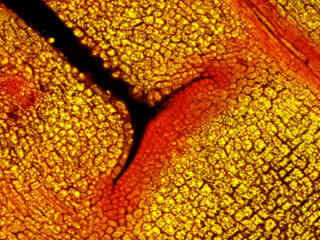
Autofluorescence emission intensity from a thin section of caster bean (Ricinus communis) tissue is illustrated in Figure 2(f). Endogenous autofluorescence in plant tissues arises from a variety of biomolecules, including chlorophyll, carotene, and xanthophyll. In the blue region, chlorophyll has an absorption band with a high extinction coefficient and produces a significant amount of fluorescence when excited with wavelengths between 420 and 460 nanometers. Note the presence of significant spectral bleed-through from autofluorescence emission in the yellow and red spectral regions with the B-2A filter combination.
Additional Specimen Images
Rat Kangaroo Cell Cytokinesis
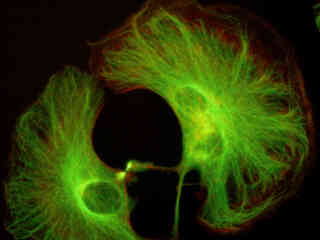
Fluorescence emission intensity from a culture of rat kangaroo (PtK2) epithelial cells that were immunofluorescently labeled with primary anti-bovine alpha-tubulin mouse monoclonal antibodies followed by goat anti-mouse Fab fragments conjugated to Alexa Fluor 488.
Mouse Kidney Tissue
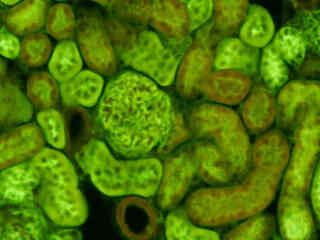
Fluorescence emission intensity from a thin section of mouse kidney labeled with multiple (3) fluorophores.
Indian Muntjac Nuclei
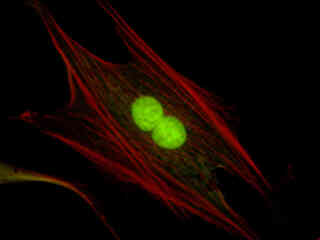
Fluorescence emission intensity from a culture of Indian Muntjac cells that were labeled with SYTOX Green to stain chromatin in the nuclei.
HeLa Cell Mitochondria
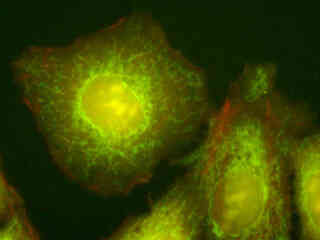
Fluorescence emission intensity from a culture of HeLa epithelial cells that were immunofluorescently labeled with primary anti-oxphos complex V inhibitor protein monoclonal antibodies (mouse) followed by goat anti-mouse Fab fragments conjugated to Alexa Fluor 488.
Contributing Authors
Related Nikon Products
Share this article:


