Dual Band Excitation: FITC-Texas Red
Ultraviolet and visible transmission spectral profiles for the Nikon FITC-Texas Red filter combination are illustrated below in Figure 1. This filter set is designed for optimal detection of signals from fluorescein isothiocyanate (FITC) and Texas Red probes in dual-labeling experiments, and incorporates an excitation filter with narrow bandpass windows in the blue (490-505 nanometers) and the green (560-580 nanometers) spectral regions. The dual emission (barrier) filter passbands incorporated into a single element allow detection of green and red emission from the two fluorochromes simultaneously. Sharp transitions between the transmission and reflection bands for each filter, and application of a dichromatic mirror having two bandpass transmission regions (polychromatic) chosen to be complementary to the emission and excitation wavelengths, permit dual-band signal detection with minimal interference.
Figure 1 - FITC-Texas Red Dual Band Excitation
Dual Excitation Filter Block FITC-Texas Red Specifications
- Excitation Filter Wavelengths: 490-505 nanometers (bandpass, 498 CWL) and 560-580 nanometers (bandpass, 570 CWL)
- Polychromatic Mirror Wavelengths: 510-555 nanometers (bandpass) and 585-665 nanometers (bandpass)
- Barrier Filter Wavelengths: 515-545 nanometers (bandpass, 530 CWL) and 600-650 nanometers (bandpass, 625 CWL)
The FITC-Texas Red dual excitation band fluorescence filter combination is designed specifically for simultaneous detection of the fluorochromes FITC and Texas Red with minimal crosstalk between bands, and can be employed with other pairs of fluorescent probes having similar spectral profiles. The shorter wavelength signal channel of the filter set selects narrowly defined spectral regions for blue excitation and green emission detection, while the longer wavelength component corresponds to green excitation and red emission detection. The FITC-Texas Red filter set is recommended when studying various combinations of the following fluorophores: FITC, green fluorescent protein (GFP), Cy2, BODIPY FL, Oregon Green, or Alexa Fluor 488 (blue excitation), paired with Texas Red or Alexa Fluor 594 (green excitation). The images presented in Figure 2 demonstrate the performance of this filter combination with a variety of fluorescence probe pairs targeted at different intracellular locations.
Figure 2 - Nikon FITC-Texas Red Dual Excitation Filter Set
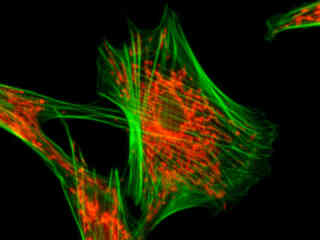
Illustrated in Figure 2(a) is the fluorescence emission from a culture of Madin-Darby canine kidney (MDCK line) cells stained with MitoTracker Red CMXRos and Alexa Fluor 488-phalloidin, which target the intracellular mitochondrial network and cytoskeletal actin filaments, respectively. The absorption maximum of MitoTracker Red CMXRos is 579 nanometers and the emission maximum occurs at 599 nanometers, while the corresponding values for Alexa Fluor 488 are 498 and 519 nanometers. In addition, the specimen was simultaneously stained with DAPI (targeting DNA in the cell nucleus; blue emission). Note the absence of signal from the blue (DAPI) fluorophore, but the bright orange-red fluorescence exhibited by the tubular mitochondria and the green emission from actin filaments in the cytoplasm.
A thin section of sheep epidermal skin tissue stained for DNA and glycoproteins with SYTOX Orange and Oregon Green 488 wheat germ agglutinin, respectively, is presented in Figure 2(b). The absorption maximum of SYTOX Orange is 547 nanometers and the emission maximum occurs at 570 nanometers, while the corresponding values for Oregon Green 488 are 496 and 524 nanometers. In addition, the specimen was simultaneously stained with Alexa Fluor 350 conjugated to phalloidin (targeting the actin network; blue emission). Note the absence of signal from the blue (Alexa Fluor 350) fluorophore, but the bright orange-red fluorescence exhibited by the nuclei and the green emission from glycoproteins in the cytoplasm and membrane components of the hair follicles.
Fluorescence emission in a culture of Indian Muntjac deerskin fibroblast cells stained with Alexa Fluor 568 conjugated to phalloidin and LysoTracker Green DND-26, which target intracellular actin and lysosomes, respectively, are displayed in Figure 2(c). The absorption maximum of Alexa Fluor 568 is 578 nanometers and the emission maximum occurs at 603 nanometers, while the corresponding values for LysoTracker Green DND-26 are 501 and 511 nanometers. In addition, the specimen was simultaneously stained with DAPI (targeting DNA in the cell nucleus; excitation at 358 nanometers and emission at 461 nanometers). Note the absence of signal from the blue fluorophore (DAPI), but the presence of bright green and orange-red fluorescence exhibited by the lysosomes and actin filaments in the cytoskeletal network.
Figure 2(d) demonstrates the fluorescence emission from a culture of HeLa carcinoma cells transfected with an EGFP-peroxisomal targeting signal 1 (PTS1) fusion protein and stained with Alexa Fluor 546-phalloidin. These fluorescent probes target the peroxisomes and cytoskeletal actin filament network, respectively. The absorption maximum of the EGFP-PTS1 chimera is 488 nanometers and the emission maximum occurs at 507 nanometers, while the corresponding values for Alexa Fluor 546 are 556 and 573 nanometers. In addition, the specimen was simultaneously stained with Hoechst 33258 (targeting the DNA in the nucleus; blue emission). Note the absence of signal from the blue fluorophore, but the bright orange-red fluorescence exhibited by the cytoskeletal actin filaments and the intense green emission from peroxisomes in the cytoplasm.
A thin section of rabbit lung tissue stained for actin filaments and glycoproteins with Alexa Fluor 546-phalloidin and Oregon Green 488 wheat germ agglutinin, respectively, is illustrated in Figure 2(e). The absorption maximum of Alexa Fluor 546 is 556 nanometers and the emission maximum occurs at 573 nanometers, while the corresponding values for Oregon Green 488 are 496 and 524 nanometers. In addition, the specimen was simultaneously stained with DAPI (targeting DNA in the nucleus; blue emission). Note the absence of signal from the blue fluorophore, but the bright orange-red fluorescence exhibited by filamentous actin and the green emission from glycoproteins in the cytoplasm and membrane components of the tissue section.
Autofluorescence emission intensity from a thin section of alfalfa (Medicago sativa) root tissue is demonstrated in Figure 2(f). Endogenous autofluorescence in plant tissues arises from a variety of biomolecules, including lignins, chlorophyll, carotene, and xanthophyll. In the blue and green excitation regions, chlorophyll has an absorption band with a high extinction coefficient and produces a significant amount of fluorescence when excited with wavelengths between 450 and 550 nanometers. For the alfalfa root tissue illustrated above, note the presence of autofluorescence emission intensity in the green and red spectral regions, which is characteristic of the Nikon FITC-Texas Red fluorescence filter combination.
Additional Specimen Images with the FITC-Texas Red Filter Combination
Madin-Darby Canine Kidney Cell Mitochondria and Actin
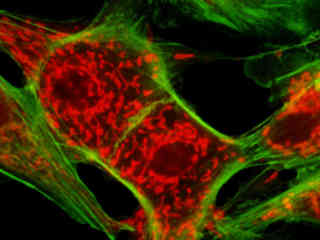
Fluorescence emission intensity from a culture of Madin-Darby canine kidney (MDCK line) cells stained with MitoTracker Red CMXRos and Alexa Fluor 488-phalloidin, which target the intracellular mitochondrial network and cytoskeletal actin filaments, respectively.
Sheep Skin Hair Follicles
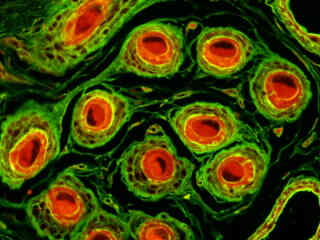
Fluorescence emission intensity from a thin section of sheep epidermal skin tissue stained for DNA and glycoproteins with SYTOX Orange and Oregon Green 488 wheat germ agglutinin, respectively.
Indian Muntjac Cell Lysosomes and Actin Cytoskeleton
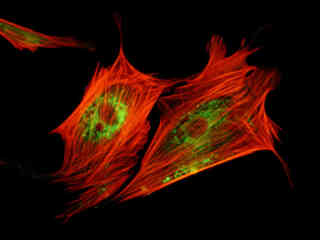
Fluorescence emission intensity from a culture of Indian Muntjac deerskin fibroblast cells stained with Alexa Fluor 568 conjugated to phalloidin and LysoTracker Green DND-26, which target intracellular actin and lysosomes, respectively.
HeLa Cell Peroxisomes and Actin
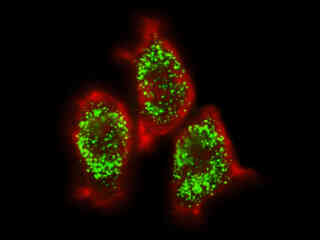
Fluorescence emission intensity from a culture of HeLa carcinoma cells transfected with an EGFP-peroxisomal targeting signal 1 (PTS1) fusion protein and stained with Alexa Fluor 546-phalloidin.
Rabbit Lung Tissue

Fluorescence emission intensity from a thin section of rabbit lung tissue stained for actin filaments and glycoproteins with Alexa Fluor 546-phalloidin and Oregon Green 488 wheat germ agglutinin, respectively.
Alfalfa Root Thin Section
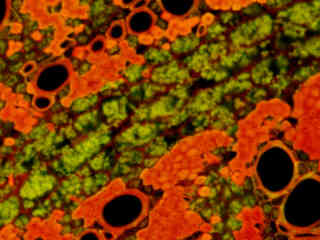
Autofluorescence emission intensity from a thin section of alfalfa (Medicago sativa) root tissue. Endogenous autofluorescence in plant tissues arises from a variety of biomolecules, including lignins, chlorophyll, carotene, and xanthophyll.
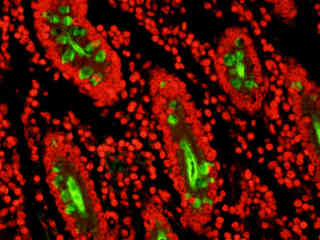
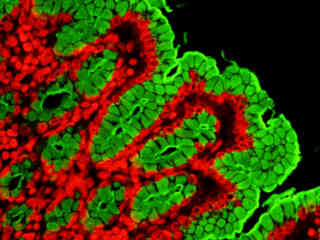
Mouse Intestine Tissue Section with SYTOX Green and Alexa Fluor 568
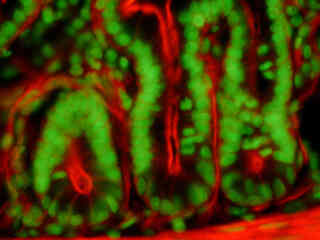
Observe the emission intensity from a thin section of mouse intestine stained with SYTOX Green for DNA in the nucleus and Alexa Fluor 568 conjugated to phalloidin (targeting filamentous actin in the brush border; orange-red emission). Both of these fluorescent probes can be imaged simultaneously with the Nikon dual excitation band FITC-Texas Red filter set.
Mouse Kidney Tissue with Alexa Fluor 488 and 568
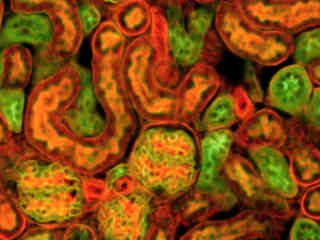
A cryostat section was of mouse kidney tissue was simultaneously stained with Alexa Fluor 488 wheat germ agglutinin (glomeruli and convoluted tubules; 519-nanometer emission) and Alexa Fluor 568 phalloidin (filamentous actin and the brush border). Images captured using the Nikon FITC-Texas Red filter combination reveal intense fluorescence signals from both the green (Alexa Fluor 488) and red (Alexa Fluor 568) probes.
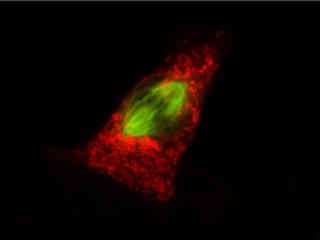
Indian Muntjac Cells with MitoTracker Red CMXRos and Alexa Fluor 488
Examine images from a culture of Indian Muntjac deerskin fibroblast cells stained with MitoTracker Red CMXRos and Alexa Fluor 488 conjugated to phalloidin, which target the mitochondrial network and intracellular actin, respectively. In addition, the specimen was simultaneously stained with DAPI (targeting DNA in the cell nucleus; excitation at 358 nanometers and emission at 461 nanometers), a blue probe that is not visible using this filter combination.
Sheep Intestine Thin Section with SYTOX Orange and Oregon Green 488
View the emission intensity from a thin section of sheep intestine tissue stained for DNA and glycoproteins with SYTOX Orange and Oregon Green 488 wheat germ agglutinin, respectively. In addition, the specimen was simultaneously stained with Alexa Fluor 350 conjugated to phalloidin (targeting the filamentous actin network; creating blue emission that is not visible in the image).
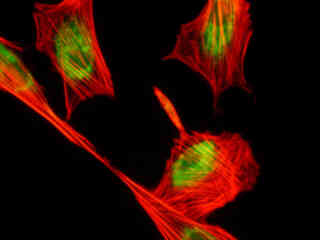
Rat Kangaroo Cells with Alexa Fluor 488 and MitoTracker Red CMXRos
A culture of rat kangaroo (PtK2) epithelial cells was immunofluorescently labeled with primary anti-bovine alpha-tubulin mouse monoclonal antibodies followed by goat anti-mouse Fab fragments conjugated to Alexa Fluor 488. In addition, the specimen was simultaneously stained for the nuclear protein cdc6 (conjugated to Pacific Blue), and for mitochondria with MitoTracker Red CMXRos.
Fibroblasts with Alexa Fluor 568 and LysoTracker DND-26
Indian Muntjac deerskin fibroblast cells stained with Alexa Fluor 568 conjugated to phalloidin and LysoTracker Green DND-26, which target intracellular actin and lysosomes, respectively, are illustrated in this section. In addition, the specimen was simultaneously stained with DAPI (targeting DNA in the cell nucleus; excitation at 358 nanometers and emission at 461 nanometers).
Canine Kidney Cells with Alexa Fluor 488 and MitoTracker Red CMXRos
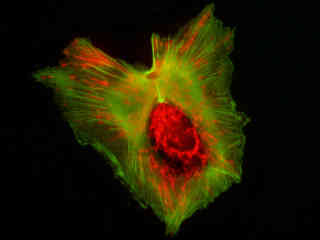
Examine a culture of Madin-Darby canine kidney (MDCK line) cells stained with MitoTracker Red CMXRos and Alexa Fluor 488-phalloidin, which target the intracellular mitochondrial network and cytoskeletal actin filaments, respectively. In addition, the specimen was simultaneously stained with DAPI (targeting DNA in the cell nucleus; blue emission).
Sheep Stomach Tissue Section with SYTOX Orange and Oregon Green 488
Sheep stomach tissue stained for DNA and glycoproteins with SYTOX Orange and Oregon Green 488 wheat germ agglutinin, respectively, is illustrated in this section. The specimen was simultaneously stained with Alexa Fluor 350 conjugated to phalloidin (targeting the actin network; blue emission).
Contributing Authors
Related Nikon Products
Share this article:


