Green Excitation: Cy3 HYQ (Bandpass Emission)
Ultraviolet, visible, and near-infrared transmission spectral profiles for the Nikon Cy3 (a high-performance set with the Nikon HYQ designation) filter combination are illustrated below in Figure 1. This filter set is one of two in the Nikon green excitation series that employs a bandpass emission (barrier) filter instead of a longpass type, and by design, effectively limits interference from fluorophores emitting wavelengths outside the target spectral range. As with other filters in the HYQ series, the slopes of the filter cut-on and cut-off transitions in theCy3 HYQ are very steep (only a couple of nanometers in size) to help reduce emission crossover, and the passbands are wider to collect more signal.
Figure 1 - Cy3 HYQ (Medium Band Green Excitation)
Green Excitation Filter Block Cy3 (HYQ) Specifications:
- Excitation Filter Wavelengths: 530-560 nanometers (bandpass, 545 CWL)
- Dichromatic Mirror Cut-on Wavelength: 570 nanometers (longpass, LP)
- Barrier Filter Wavelengths: 573-648 nanometers (bandpass, 610 CWL)
The Cy3 fluorescence filter combination (as discussed above, a member of the Nikon HYQ high-performance interference filter series) is similar in configuration to the standard bandpass emission green excitation set (G-2E/C), but with wider bandpass windows for the excitation and emission (barrier) filters. These high-performance filters are fabricated with a greater number of interference cavities in both the excitation and emission filters, allowing a closer proximity between spectral profiles without suffering excessive crosstalk. The dichromatic mirror cut-on wavelength is 570 nanometers, and is combined with a medium 30-nanometer excitation passband (530-560 nanometers) along with a very broad 75-nanometer emission passband (573-648 nanometers). The set enables selective excitation and detection of specific popular fluorophores used in multiple labeling experiments, and is generally applicable to a wide range of probes excited by green wavelengths.
The Cy3 HYQ filter combination is recommended for use with the cyanine fluorescent probe Cy3, and is designed to reduce or eliminate interference from fluorophores emitting in the red and near-infrared when probes such as tetramethylrhodamine isothiocyanate (TRITC) and DiI are used in multiple labeling techniques. The Cy3 HYQ filter set can be utilized with essentially the same fluorochromes as the G-2E/C combination, and produces, in comparison, somewhat brighter images due to increased excitation and emission energy allowed by the wider bandpass windows. Additionally, the extension of the emission bandpass to lower wavelengths, compared to the G-2E/C set, produces images with hues shifted toward orange and yellow. The Cy3 HYQ set is recommended when studying the following fluorophores: Cy3, Cy3.1.8, Acridine Red, Alexa Fluor 546, Alexa Fluor 555, Alizarin Red, BODIPY probes, Calcium Orange, DiI, DiIC16, DiIC18, ethidium bromide, NeuroTrace 530/615, propidium iodide, Pyronin B, RedoxSensor Red CC-1, rhodamine derivatives, Sevron Brilliant Red, and TRITC. The images presented in Figure 2 demonstrate the performance of this filter combination with a variety of green-absorbing fluorescence probes targeted at different intracellular locations.
Figure 2 - Nikon Cy3 HYQ Green Excitation Bandpass Filter Set
Illustrated in Figure 2(a) is the fluorescence emission intensity from a culture of bovine pulmonary artery endothelial cells stained with MitoTracker Red CMXRos, which targets the intracellular mitochondrial network. The absorption maximum of MitoTracker Red CMXRos is 579 nanometers and the emission maximum occurs at 599 nanometers. In addition, the specimen was simultaneously stained with DAPI (targeting DNA in the cell nucleus; blue emission) and BODIPY FL-phallacidin (targeting actin; green emission). Note the absence of signal from the blue (DAPI) and green (BODIPY) fluorophores, but the bright yellow-orange fluorescence exhibited by the tubular mitochondria.
A culture of Indian Muntjac deerskin fibroblast cells stained with Alexa Fluor 568 conjugated to phalloidin, which binds to the intracellular filamentous actin network, is presented in Figure 2(b). The absorption maximum of Alexa Fluor 568 is 578 nanometers and the emission maximum occurs at 603 nanometers in the orange region of the spectrum. In addition, the specimen was simultaneously stained with DAPI (targeting DNA in the cell nucleus; blue emission) and MitoTracker Green FM (targeting mitochondria; green emission). Note the absence of signal from the green (MitoTracker) and blue (DAPI) fluorophores, which are not efficiently excited at green wavelengths, but the bright orange-red fluorescence exhibited by the actin filaments.
Fluorescence emission intensity from a thin section of mouse intestine stained with Alexa Fluor 350 wheat germ agglutinin, a blue fluorescent lectin that is specific to the mucus of goblet cells is demonstrated in Figure 2(c). In addition, the specimen was simultaneously stained with Alexa Fluor 568 phalloidin (filamentous actin; 600 nanometer emission) and SYTOX Green (nuclei; 504 nanometer excitation and 523 nanometer emission). Note the low level of background noise in comparison to the other Nikon longpass filter combinations (G-2A and G-2B), and the significant amount of yellow-red signal arising from Alexa Fluor 568 that appears in the image.
Presented in Figure 2(d) are HeLa cells immunofluorescently labeled with primary anti-histone (pan) mouse monoclonal antibodies followed by goat anti-mouse Fab fragments conjugated to Alexa Fluor 546. The absorption maximum of Alexa Fluor 546 is 556 nanometers and the emission maximum occurs at 573 nanometers (in the yellow region of the visible light spectrum). The primary antibody, produced from purified nuclear fractions of HeLa cells, binds specifically to an antigen determinant that is present on all five histone proteins (H1, H2A, H2B, H3, and H4). Note the strong yellow-orange fluorescence intensity from the cells undergoing mitosis, but the reduced emission intensity of interphase nuclei.
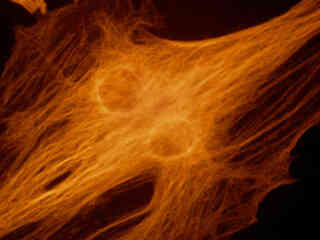
A pair of daughter rat kangaroo (PtK2) epithelial cells, illustrated in Figure 2(e), were among those in a culture that was immunofluorescently labeled with primary anti-bovine alpha-tubulin mouse monoclonal antibodies followed by goat anti-mouse Fab fragments conjugated to Alexa Fluor 546. The absorption maximum of Alexa Fluor 546 is 556 nanometers and the emission maximum occurs at 573 nanometers (in the yellow region of the visible light spectrum). Note the prominent yellow-orange staining of the intracellular microtubule network that extends throughout the cytoplasm.
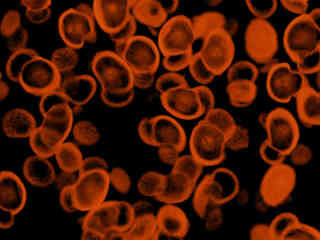
Autofluorescence emission intensity from pine (Pinus taeda) pollen grains is demonstrated in Figure 2(f). Endogenous autofluorescence in plant tissues arises from a variety of biomolecules, including chlorophyll, carotene, and xanthophyll. In the blue-violet region, chlorophyll has an absorption band with a high extinction coefficient and produces a significant amount of fluorescence when excited with wavelengths between 400 and 440 nanometers. Note the presence of autofluorescence emission intensity in the orange and red spectral regions, which is strongly reminiscent of a darkfield image.
Additional Specimen Images with the Cy3 HYQ Filter Combination
Bovine Pulmonary Artery Cell Mitochondria
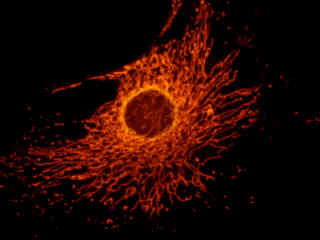
Fluorescence emission intensity from a culture of bovine pulmonary artery endothelial cells stained with MitoTracker Red CMXRos, which targets the intracellular mitochondrial network.
Indian Muntjac Cell Actin Cytoskeleton
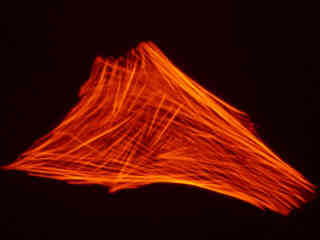
Fluorescence emission intensity from a culture of Indian Muntjac deerskin fibroblast cells stained with Alexa Fluor 568 conjugated to phalloidin, which binds to the intracellular filamentous actin network.
Mouse Intestine Thin Section
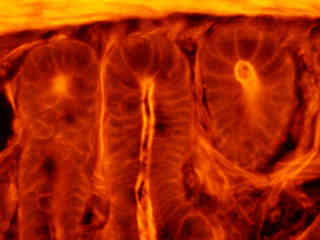
Fluorescence emission intensity from a thin section of mouse intestine stained with Alexa Fluor 350 wheat germ agglutinin, a blue fluorescent lectin that is specific to the mucus of goblet cells.
HeLa Cell Histones
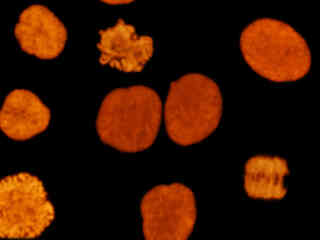
Fluorescence emission intensity from a culture of HeLa cells that were immunofluorescently labeled with primary anti-histone (pan) mouse monoclonal antibodies followed by goat anti-mouse Fab fragments conjugated to Alexa Fluor 546.
Contributing Authors
Related Nikon Products
Share this article:


