Green Excitation: G-1B (Longpass Emission)
The Nikon G-1B longpass emission filter set is similar to the G-1A combination, utilizing the same narrow bandpass (10 nanometers) excitation filter, centered at 546 nanometers, but with different dichromatic mirror and emission filter specifications. The G-1B filter set has increased separation between the cut-on wavelengths of the dichromatic mirror and emission filter (565 and 590 nanometers, respectively), enabling transmission of orange and red, with minimal yellow emission from fluorophores absorbing near the center of the green spectral region. Ultraviolet, visible, and near-infrared transmission spectral profiles for the Nikon G-1Bfilter combination are illustrated below in Figure 1. The increased emission filter cut-on wavelength results in images with redder spectral characteristics than those produced by the G-1A combination.
Figure 1 - G-1B (Narrow Band Green Excitation)
Green Excitation Filter Block G-1B Specifications
- Excitation Filter Wavelengths: 541-551 nanometers (bandpass, 546 CWL)
- Dichromatic Mirror Cut-on Wavelength: 565 nanometers (longpass, LP)
- Barrier Filter Wavelengths: 590 nanometer cut-on (longpass, LP)
The G-1B filter combination is equipped with a narrow passband (10 nanometers) excitation filter, which minimizes autofluorescence. The center wavelength of the filter is positioned to correspond to the 546-nanometer emission line (referred to as the e-line) of a mercury arc-discharge source, which is the recommended application for the G-1B set. The longpass emission (barrier) filter used in this set is designed to collect fluorescence signals at wavelengths exceeding 590 nanometers, permitting visualization of orange and red emission, while blocking most yellow wavelengths. The G-1B filter green excitation filter combination is recommended when investigating the following fluorophores: Alexa Fluors (532, 546, 555, 568, and 594), dichlorodimethoxyfluorescein (JOE), Alizarin Red, BODIPY probes, Calcium Orange, Cy3, Cy3.1.8, dioctadecyl tetramethylindocarbocyanine (DiI), ethidium bromide, FluoroRuby, hexachlorofluorescein (HEX), LDS 751-DNA, MitoTracker Orange and Red, R and B-phycoerythrin, POPO-3, PO-PRO-3, propidium iodide (PI), Pyronin B, RedoxSensor Red CC-1, RH probes (237, 414, 421, 795), many rhodamine derivatives, Sevron Brilliant Red, SYTO derivatives, SYTOX Orange, and Xylene Orange. The images presented in Figure 2 demonstrate the performance of this filter combination with a variety of green-absorbing fluorescence probes targeted at different intracellular locations.
Figure 2 - Nikon G-1B Green Excitation Longpass Emission Filter Set
Presented in Figure 2(a) fluorescence emission from a culture of Indian Muntjac deerskin fibroblast cells stained with Alexa Fluor 568 conjugated to phalloidin, which binds to the intracellular filamentous actin network. The absorption maximum of Alexa Fluor 568 is 578 nanometers and the emission maximum occurs at 603 nanometers in the orange region of the spectrum. In addition, the specimen was simultaneously stained with DAPI (targeting DNA in the cell nucleus; blue emission) and MitoTracker Green FM (targeting mitochondria; green emission). Note the absence of signal from the green (MitoTracker) and blue (DAPI) fluorophores, which are not efficiently excited by the narrow passband of the G-1B filter set. However, the presence of relatively bright orange-red fluorescence exhibited by the actin filaments is clearly evident in the image.
HeLa epithelial cells stained with MitoTracker Red CMXRos, which targets the intracellular mitochondrial network, are illustrated in Figure 2(b). The absorption maximum of MitoTracker Red CMXRos is 579 nanometers and the emission maximum occurs at 599 nanometers. In addition, the specimen was simultaneously stained with DAPI (binding to DNA in the cell nucleus; blue emission) and Alexa Fluor 488 conjugated to phalloidin (targeting actin; green emission). Note the absence of signal from the blue and green fluorophores, which are not efficiently excited by the narrow passband of the G-1B filter combination. However, the relatively bright yellow-orange fluorescence exhibited by the tubular mitochondria is quite evident in the image.
Fluorescence emission from a culture of bovine pulmonary artery endothelial cells that were immunofluorescently labeled with primary anti-bovine alpha-tubulin mouse monoclonal antibodies followed by goat anti-mouse Fab fragments conjugated to Alexa Fluor 546 is displayed in Figure 2(c). The absorption maximum of Alexa Fluor 546 is 556 nanometers and the emission maximum occurs at 573 nanometers (in the yellow region of the visible light spectrum). Note the prominent orange-red staining of the intracellular microtubule network that extends throughout the cytoplasm.
A culture of rat skeletal muscle tissue cells (L6 cell line; myoblasts) that were labeled with SYTOX Orange for nuclear DNA is presented in Figure 2(d). The absorption maximum of SYTOX Orange is 547 nanometers and the emission maximum occurs at 570 nanometers. In addition, the specimen was simultaneously stained for F-actin with Alexa Fluor 350 conjugated to phalloidin, and for mitochondria with MitoTracker Green FM. Note the presence of substantial signal levels from the red (SYTOX Orange) fluorophore, but the lack of fluorescence intensity from the blue (Alexa Fluor 350) and green (MitoTracker Green FM) probes.
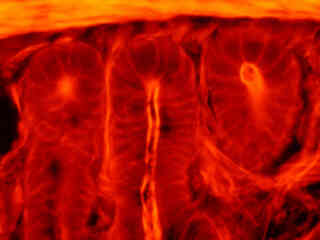
Figure 2(e) illustrates the fluorescence emission from a thin section of mouse intestine stained with Alexa Fluor 350 wheat germ agglutinin, a blue fluorescent lectin that is specific to the mucus of goblet cells. In addition, the specimen was simultaneously stained with Alexa Fluor 568 phalloidin (filamentous actin; 600 nanometer emission) and SYTOX Green (nuclei; 504 nanometer excitation and 523 nanometer emission). Note the low level of background noise in comparison to the Nikon wide passband excitation longpass emission filter combinations (G-2A and G-2B), and the significant amount of orange-red signal arising from Alexa Fluor 568 that appears in the image.
Autofluorescence emission intensity from a thin section of fern strobilus (Cyrtomium falcatum) tissue is shown in Figure 2(f). Endogenous autofluorescence in plant tissues arises from a variety of biomolecules, including chlorophyll, carotene, and xanthophyll. In the green excitation region, chlorophyll has an absorption band with a low extinction coefficient, but still produces a detectable level of fluorescence at emission wavelengths of 550 nanometers and above (green, yellow, orange, and red).
Additional Specimen Images with the G-1B Filter Combination
Indian Muntjac Cell Actin Cytoskeleton
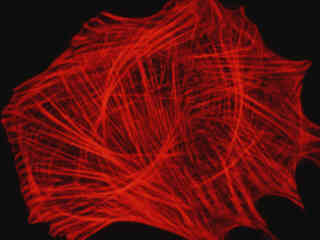
Fluorescence emission from a culture of Indian Muntjac deerskin fibroblast cells stained with Alexa Fluor 568 conjugated to phalloidin, which binds to the intracellular filamentous actin network.
HeLa Cell Mitochondria
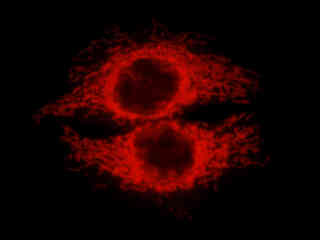
Fluorescence emission intensity from a culture of HeLa epithelial cells stained with MitoTracker Red CMXRos, which targets the intracellular mitochondrial network.
Bovine Pulmonary Artery Cell Tubulin
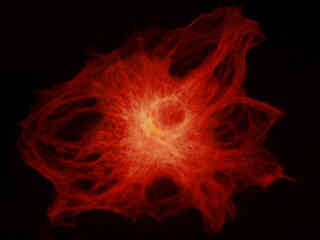
Fluorescence emission intensity from a culture of bovine pulmonary artery endothelial cells that were immunofluorescently labeled with primary anti-bovine alpha-tubulin mouse monoclonal antibodies followed by goat anti-mouse Fab fragments conjugated to Alexa Fluor 546.
Rat Skeletal Muscle Nuclei
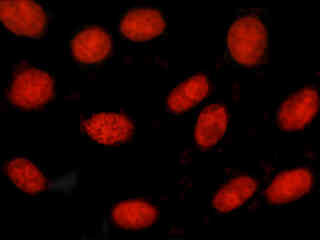
Fluorescence emission intensity from a culture of rat skeletal muscle tissue cells (L6 cell line; myoblasts) that were labeled with SYTOX Orange for nuclear DNA.

Contributing Authors
Related Nikon Products
Share this article:


