Green Excitation: G-2E/C (Bandpass Emission)
Ultraviolet, visible, and near-infrared transmission spectral profiles for the Nikon G-2E/C filter combination are illustrated below in Figure 1. This filter set is one of two in the Nikon green excitation series that employs a bandpass emission (barrier) filter instead of a longpass version, and is intended to limit interference from fluorophores emitting outside the band for which the combination is optimized. The 60-nanometer emission window (590-650 nanometers) is combined with a medium 25-nanometer excitation passband (528-553 nanometers) to allow selective excitation and detection of specific popular fluorophores used in multiple labeling experiments. The G-2E/C filter combination is equipped with a 565-nanometer (cut-on wavelength) longpass dichromatic mirror.
Figure 1 - G-2E/C (Narrow Band Green Excitation)
Green Excitation Filter Block G-2E/C Specifications
- Excitation Filter Wavelengths: 528-553 nanometers (bandpass, 540 CWL)
- Dichromatic Mirror Cut-on Wavelength: 565 nanometers (longpass, LP)
- Barrier Filter Wavelengths: 590-650 nanometers (bandpass, 620 CWL)
The G-2E/C filter combination is optimized for use with popular fluorescent probes such as tetramethylrhodamine isothiocyanate (TRITC), Cy3, and DiI, when they are used alone or in multiple labeling techniques, and is also recommended for use with red fluorescent protein (DsRed). The bandpass emission filter functions to reduce or eliminate interference from fluorophores emitting in the deep red or near-infrared spectral regions. Compared to some other filter combinations that may be used in these applications (such as the Cy3 set), the G-2E/C combination produces visually redder images, due to the relatively high lower wavelength limit of the emission bandpass (590 nanometers), which excludes most of the yellow signal. An additional effect of the higher-wavelength bandpass is a reduction of total level of signal collected when imaging fluorochromes in the rhodamine category. The G-2E/Cset is recommended when studying the following fluorophores: Acridine Red, Alexa Fluors (546, 555, and 568), Alizarin Red, BODIPY probes, Calcium Orange, Cy3, DiI, DiIC16, DiIC18, ethidium bromide, NeuroTrace 530/615, propidium iodide, Pyronin B, RedoxSensor Red CC-1, rhodamine derivatives, Sevron Brilliant Red, and TRITC. The images presented in Figure 2 demonstrate the performance of this filter combination with a variety of green-absorbing fluorescence probes targeted at different intracellular locations.
Figure 2 - Nikon G-2E/C Green Excitation Bandpass Filter Set
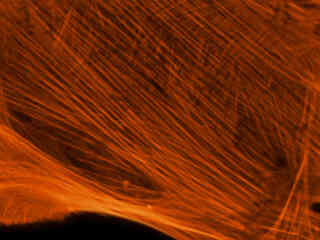
A pair of daughter rat kangaroo (PtK2) epithelial cells, illustrated in Figure 2(a), were among those in a culture that was immunofluorescently labeled with primary anti-bovine alpha-tubulin mouse monoclonal antibodies followed by goat anti-mouse Fab fragments conjugated to Alexa Fluor 546. The absorption maximum of Alexa Fluor 546 is 556 nanometers and the emission maximum occurs at 573 nanometers (in the yellow region of the visible light spectrum). Note the prominent yellow-orange staining of the intracellular microtubule network that extends throughout the cytoplasm.
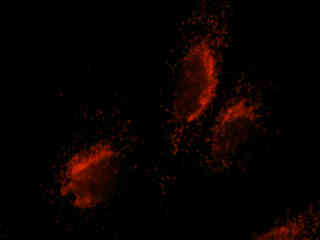
Presented in Figure 2(b) is the fluorescence emission intensity from a culture of bovine pulmonary artery endothelial cells stained with MitoTracker Red CMXRos, which targets the intracellular mitochondrial network. The absorption maximum of MitoTracker Red CMXRos is 579 nanometers and the emission maximum occurs at 599 nanometers. In addition, the specimen was simultaneously stained with DAPI (targeting DNA in the cell nucleus; blue emission) and BODIPY FL-phallacidin (targeting actin; green emission). Note the absence of signal from the blue (DAPI) and green (BODIPY) fluorophores, but the bright orange-red fluorescence exhibited by the tubular mitochondria.
Fluorescence emission intensity from a thin section of mouse kidney stained with multiple (3) fluorophores is demonstrated in Figure 2(c). Nuclei in the tissue section were targeted with the nucleic acid probe DAPI, which has an excitation maximum at 358 nanometers and an emission maximum at 461 nanometers when bound to DNA in cell cultures and tissue sections. In addition, the cryostat section was also simultaneously stained with Alexa Fluor 488 wheat germ agglutinin (glomeruli and convoluted tubules) and Alexa Fluor 568 phalloidin (filamentous actin and the brush border). Note the absence of signal from both the blue (DAPI) and green (Alexa Fluor 488) probes, but the intense orange-red fluorescence due to the presence of Alexa Fluor 568 in the actin and brush border networks.
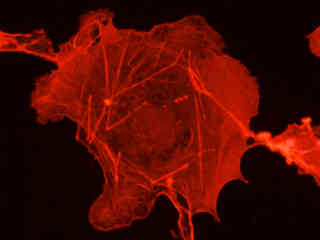
HeLa cells that were immunofluorescently labeled with primary anti-histone (pan) mouse monoclonal antibodies followed by goat anti-mouse Fab fragments conjugated to Alexa Fluor 546 are depicted in Figure 2(d). The primary antibody, produced from purified nuclear fractions of HeLa cells, binds specifically to an antigen determinant that is present on all five histone proteins (H1, H2A, H2B, H3, and H4). The same probe (Alexa Fluor 546, but conjugated to phalloidin) was used to label cellular actin from African green monkey kidney cells (COS-1) in figure 2(e). This cell line does not display the prominent microfilaments typically seen with many epithelial cultures, such as Indian Muntjac, HeLa, and PtK2, but instead forms smaller fibrils that have a much smoother appearance.
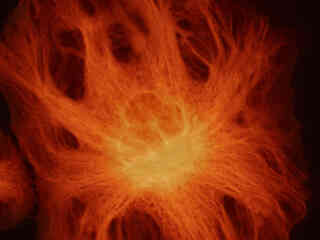
Autofluorescence emission intensity from a palm tree (Cycas pectinata) microsporophyll thin section is presented in Figure 2(f). Endogenous autofluorescence in plant tissues arises from a variety of biomolecules, including chlorophyll, carotene, and xanthophyll. In the green excitation region, chlorophyll has an absorption band with a low extinction coefficient, but still produces a detectable level of fluorescence at emission wavelengths of 550 nanometers and above (green, yellow, orange, and red). For the palm tree tissue, note the presence of autofluorescence emission intensity in the orange and red spectral regions, which is strongly reminiscent of a darkfield image.
Additional Specimen Images with the G-2E/C Filter Combination
Rat Kangaroo Cell Tubulin
Fluorescence emission intensity from a culture of rat kangaroo (PtK2) epithelial cells that were immunofluorescently labeled with primary anti-bovine alpha-tubulin mouse monoclonal antibodies followed by goat anti-mouse Fab fragments conjugated to Alexa Fluor 546.
Bovine Pulmonary Artery Cell Mitochondria
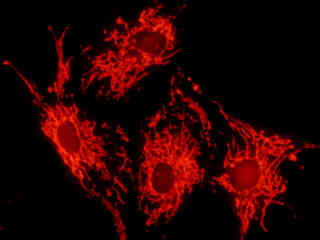
Fluorescence emission intensity from a culture of bovine pulmonary artery endothelial cells stained with MitoTracker Red CMXRos, which targets the intracellular mitochondrial network.
Mouse Kidney Tissue
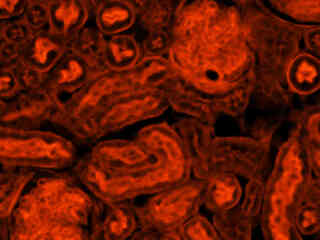
Fluorescence emission intensity from a thin section of mouse kidney stained with multiple (3) fluorophores.
HeLa Cell Histones
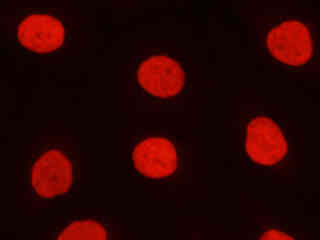
Fluorescence emission intensity from a culture of HeLa cells that were immunofluorescently labeled with primary anti-histone (pan) mouse monoclonal antibodies followed by goat anti-mouse Fab fragments conjugated to Alexa Fluor 546.
African Green Monkey Kidney Cell Actin Cytoskeleton
Fluorescence emission intensity from a culture of African green monkey kidney (COS-1) cells stained with Alexa Fluor 546 conjugated to phalloidin, which binds to the intracellular filamentous actin network.
Cycadophyta Microsporophyll Tissue
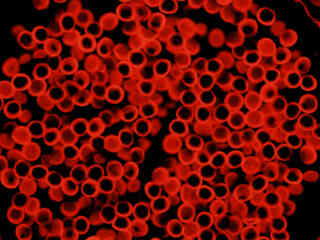
Autofluorescence emission intensity from a palm tree (Cycas pectinata) microsporophyll thin section.
Indian Muntjac Golgi Apparatus with Alexa Fluor 546
The fibroblast cells were immunofluorescently labeled with primary anti-human golgin-97 mouse monoclonal antibodies followed by goat anti-mouse Fab fragments conjugated to Alexa Fluor 546. In addition, the specimen was simultaneously stained with SYTOX Green (targeting DNA in the cell nucleus; green emission) and Alexa Fluor 350 conjugated to phalloidin (targeting the cytoskeletal actin network; blue emission).
Indian Muntjac Actin Cytoskeleton with Alexa Fluor 532
Indian Muntjac deerskin fibroblast cells stained with Alexa Fluor 532 conjugated to phalloidin, which binds to the intracellular filamentous actin network, are examined in this section. The absorption maximum of Alexa Fluor 532 is 531 nanometers and the emission maximum occurs at 554 nanometers in the green-yellow region of the spectrum. In addition, the specimen was simultaneously stained with DAPI (targeting DNA in the cell nucleus; blue emission) and MitoTracker Green FM (targeting mitochondria; green emission).
Lysosomes in Distressed Cells with LysoTracker Red
Nuclei of highly stressed Indian Muntjac cells were targeted with the nucleic acid probe SYTOX Green, which has an excitation maximum at 504 nanometers and an emission maximum at 523 nanometers when bound to DNA. In addition, the cells were stained with LysoTracker Red DND-99 (targeting lysosomes; excitation at 577 nanometers and emission at 590 nanometers) and Alexa Fluor 350 conjugated to phalloidin.
Mouse Intestine Thin Section with Alexa Fluor 568
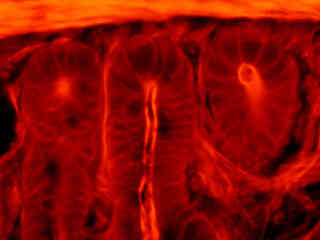
Observe the emission intensity from a thin section of mouse intestine stained with Alexa Fluor 350 wheat germ agglutinin, a blue fluorescent lectin that is specific to the mucus of goblet cells. In addition, the specimen was simultaneously stained with Alexa Fluor 568 phalloidin (filamentous actin; orange emission) and SYTOX Green (nuclei; green emission).
Rat Kangaroo Kidney (PtK2) Cell Nuclear Cdc6 Protein with Alexa Fluor 568
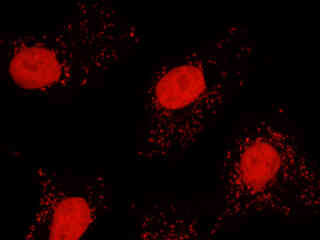
Orange-red fluorescence emission can be observed in a fixed and stained culture of rat kangaroo kidney epithelial cells (PtK2 cell line) that were immunofluorescently labeled with primary anti-cdc6 (human) mouse monoclonal antibodies followed by goat anti-mouse Fab fragments conjugated to Alexa Fluor 568. In addition, the specimen was simultaneously stained for F-actin with Alexa Fluor 488 conjugated to phalloidin, and for DNA with Hoechst 33258.
Rat Skeletal Muscle Nuclei with SYTOX Orange
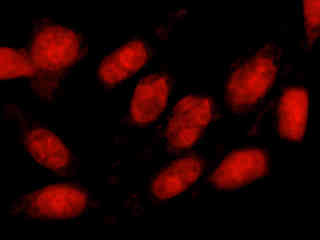
Fluorescence emission intensity from a culture of rat skeletal muscle tissue cells (L6 cell line; myoblasts) that were labeled with SYTOX Orange for nuclear DNA. The absorption maximum of SYTOX Orange is 547 nanometers and the emission maximum occurs at 570 nanometers. In addition, the specimen was simultaneously stained for F-actin with Alexa Fluor 350 conjugated to phalloidin, and for mitochondria with MitoTracker Green FM.
Rat Thoracic Aorta Intermediate Filaments with Alexa Fluor 546
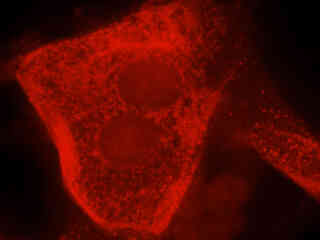
This section examines a culture of rat thoracic aorta (muscle) cells that were immunofluorescently labeled with primary anti-desmin (an intermediate filament protein) mouse monoclonal antibodies followed by goat anti-mouse Fab fragments conjugated to Alexa Fluor 546. In addition, the specimen was simultaneously stained for F-actin with Alexa Fluor 350 (blue) conjugated to phalloidin, and for DNA with SYTOX Green.
Contributing Authors
Related Nikon Products
Share this article:


