Triple Band Excitation: DAPI-FITC-TRITC
Ultraviolet and visible transmission spectral profiles for the Nikon DAPI-FITC-TRITC filter combination are illustrated below in Figure 1. This filter set is designed for optimal detection of DAPI, FITC (fluorescein isothiocyanate), and TRITC (tetramethylrhodamine isothiocyanate) probes when applied in combination, and incorporates an excitation filter with narrow bandpass windows in the violet (385 to 400 nanometers), blue (475 to 490 nanometers), and green (545 to 565 nanometers) spectral regions.
Figure 1 - DAPI-FITC-TRITC (Triple Band Excitation)
Three emission (barrier) filter bandpass regions allow detection of blue, green, and orange-red emission from up to three fluorochromes simultaneously. Sharp transitions between transmission and reflection bands for each filter, and application of a dichromatic mirror having multiple bandpass transmission regions chosen to be complementary to the emission and excitation wavelengths, permit triple-band signal detection with minimal crossover, interference, and noise.
Triple Excitation Filter Block DAPI-FITC-TRITC Specifications
- Excitation Filter Wavelengths: 385-400 nanometers (bandpass, 393 CWL), 475-490 nanometers (bandpass, 483 CWL), and 545-565 nanometers (bandpass, 555 CWL)
- Dichromatic Mirror Wavelengths: 435-470 nanometers (bandpass), 500-540 nanometers (bandpass), and 570-645 nanometers (bandpass)
- Barrier Filter Wavelengths: 450-465 nanometers (bandpass, 458 CWL), 505-535 nanometers (bandpass, 520 CWL), and 580-620 nanometers (bandpass, 600 CWL)
The DAPI-FITC-TRITC triple band fluorescence filter combination is designed specifically for simultaneous detection of the fluorochromes DAPI, FITC, and TRITC with minimal crossover (spectral bleed-through) between adjacent bands, and it can also be employed with other combinations of fluorescent probes that have similar spectral profiles. The short wavelength signal channel of the filter set selects narrowly defined spectral regions for violet excitation and blue emission detection; a second, longer-wavelength channel corresponds to blue excitation and green emission detection, and green excitation coupled to orange-red emission constitutes the third band of the filter set. The short wavelength excitation transmission is deliberately reduced in size to provide better balance of the blue emission with the other fluorochrome signals, and also to minimize photobleaching. This filter set is recommended when studying various combinations of fluorophores chosen from the following three groups: DAPI, blue fluorescent protein (BFP), or Hoechst dyes (violet excitation); FITC, green fluorescent protein (GFP), Cy2, or Alexa Fluor 488 (blue excitation); TRITC, DsRed, Cy3, Alexa Fluor 546, or Mito Tracker Red CMXRos (green excitation). The images presented in Figure 2 demonstrate the performance of this filter set with a variety of fluorescence probe combinations targeted at different intracellular locations.
Figure 2 - Nikon DAPI-FITC-TRITC Triple Excitation Filter Set
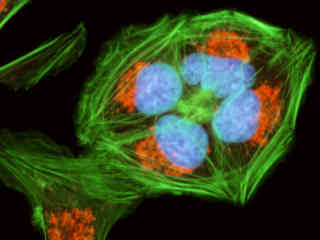
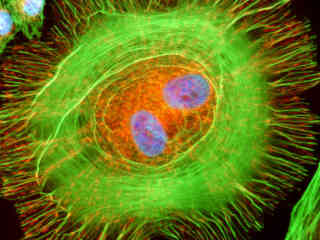
Figure 2(a) illustrates the fluorescence emission from a culture of human osteosarcoma cells (U-2 line) stained with MitoTracker Red CMXRos, Alexa Fluor 488 conjugated to phalloidin, and DAPI, which target the intracellular mitochondrial network, cytoskeletal actin filaments, and nucleus, respectively. The visible light absorption maximum of MitoTracker Red CMXRos is 579 nanometers and the emission maximum occurs at 599 nanometers, while the corresponding values for Alexa Fluor 488 are 495 and 519 nanometers. Note the remarkable symmetry in these four daughter cells, which is clearly revealed by the presence of high signal levels from all three of the fluorophores employed to stain the specimen.
A thin section of rat skin tissue stained for DNA and glycoproteins with DAPI and tetramethylrhodamine (TMR) conjugated to wheat germ agglutinin, respectively, is presented in Figure 2(b). The ultraviolet light absorption maximum of DAPI is 358 nanometers and the visible emission maximum occurs at 461 nanometers, while the corresponding values for TMR are 550 and 573 nanometers. In addition, the specimen was simultaneously labeled with Alexa Fluor 488 conjugated to phalloidin (targeting the actin network; green emission). Note the presence of both overlapping and discrete signals from all three of these fluorophores.
Fluorescence emission intensity from a culture of bovine pulmonary artery endothelial cells that were immunofluorescently labeled with primary anti-bovine alpha-tubulin mouse monoclonal antibodies followed by goat anti-mouse Fab fragments conjugated to BODIPY FL is illustrated in Figure 2(c). The cell culture was simultaneously stained with Texas Red phalloidin and DAPI, which target the cytoskeletal actin network and DNA in the nucleus, respectively. The visible light absorption maximum of BODIPY FL is 505 nanometers and the emission maximum occurs at 513 nanometers, while the corresponding values for Texas Red are 595 and 620 nanometers.
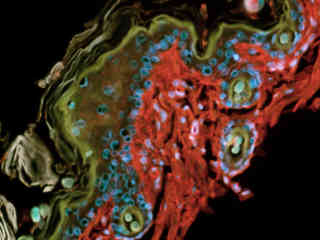
Featured in Figure 2(d) is a thin section of mouse intestine stained with Alexa Fluor 350 wheat germ agglutinin, a blue fluorescent lectin that is specific to the mucus of goblet cells. In addition, the specimen was simultaneously stained with Alexa Fluor 568 phalloidin (filamentous actin; 600 nanometer emission) and SYTOX Green (nuclei; 504 nanometer excitation and 523 nanometer emission). Note the presence of signal from the blue fluorophore (Alexa Fluor 350), as well as the bright green fluorescence of nuclei in the tissue specimen due to SYTOX Green, and the orange-red fluorescence (Alexa Fluor 568) from actin filaments in the brush border.
Normal human lung fibroblast cells (MRC-5 line) stained with MitoTracker Red CMXRos and Alexa Fluor 488 conjugated to phalloidin, which target the intracellular mitochondrial network and cytoskeletal actin filaments, respectively, are illustrated in Figure 2(e). In addition, the specimen was simultaneously stained with DAPI (targeting DNA in the cell nucleus; ultraviolet excitation with blue emission). Note the presence of relatively balanced, high signal levels from all three of the fluorophores employed to stain the specimen.
Autofluorescence emission intensity from a thin section of wheat grain (Triticum aestivum) tissue is demonstrated in Figure 2(f). Endogenous autofluorescence in plant tissues arises from a variety of biomolecules, including lignins, chlorophyll, carotene, and xanthophyll. In the blue and green excitation regions, chlorophyll has an absorption band with a high extinction coefficient and produces a significant amount of fluorescence when excited with wavelengths between 450 and 550 nanometers. Other endogenous fluorophores are excited by ultraviolet light with this filter combination. For the wheat grain tissue illustrated above, note the presence of autofluorescence emission intensity in the blue, green, and red spectral regions, which is characteristic of the Nikon DAPI-FITC-TRITC fluorescence filter combination.
Additional Specimen Images with the DAPI-FITC-TRITC Filter Combination
Human Osteosarcoma Cell Nuclei, Mitochondria, and Actin
Fluorescence emission intensity from a culture of human osteosarcoma cells (U-2 line) stained with MitoTracker Red CMXRos and Alexa Fluor 488 conjugated to phalloidin, which target the intracellular mitochondrial network and cytoskeletal actin filaments, respectively.
Rat Skin Tissue Section
Fluorescence emission intensity from a thin section of rat skin tissue stained for DNA and glycoproteins with DAPI and tetramethylrhodamine (TMR) conjugated to wheat germ agglutinin, respectively.
Bovine Pulmonary Artery Cell Nuclei, Actin, and Tubulin
Fluorescence emission intensity from a culture of bovine pulmonary artery endothelial cells that were immunofluorescently labeled with primary anti-bovine alpha-tubulin mouse monoclonal antibodies followed by goat anti-mouse Fab fragments conjugated to BODIPY FL.
Mouse Intestine Thin Section
Fluorescence emission intensity from a thin section of mouse intestine stained with Alexa Fluor 350 wheat germ agglutinin, a blue fluorescent lectin that is specific to the mucus of goblet cells.
Human Lung Cell Nuclei, Mitochondria, and Actin
Fluorescence emission intensity from a culture of human lung cells (MRC-5 line) stained with MitoTracker Red CMXRos and Alexa Fluor 488 conjugated to phalloidin, which target the intracellular mitochondrial network and cytoskeletal actin filaments, respectively.
Wheat Grain Thin Section
Autofluorescence emission intensity from a thin section of wheat grain (Triticum aestivum) tissue. Endogenous autofluorescence in plant tissues arises from a variety of biomolecules, including lignins, chlorophyll, carotene, and xanthophyll.
Canine Kidney Cells with DAPI, Alexa Fluor 568, and FITC
Examine the fluorescence emission intensity from a culture of canine kidney epithelial cells (Madin-Darby; MDCK line) that were immunofluorescently labeled with primary anti-human golgin-97 mouse monoclonal antibodies followed by goat anti-mouse Fab fragments conjugated to fluorescein (through the isothiocyanate, FITC). The visible light absorption maximum of FITC is 494 nanometers and the emission maximum occurs at 518 nanometers in the blue-green region of the spectrum. In addition, the specimen was simultaneously stained with DAPI (targeting DNA in the cell nucleus; blue emission) and Alexa Fluor 568 conjugated to phalloidin.
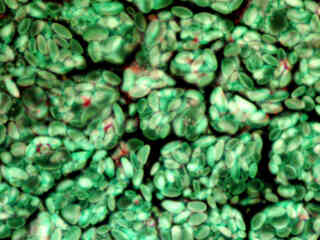
Corn Kernel Autofluorescence
View the emission intensity from a thin section of corn kernel (Zea mays) tissue using the Nikon DAPI-FITC-TRITC filter set. For the corn kernel tissue illustrated in this section, note the presence of autofluorescence emission intensity in the blue, green, and red spectral regions (in many areas, mixed together to form white).
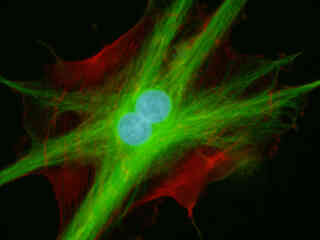
Albino Swiss Mouse Embryo Cells with DAPI, MitoTracker Red CMXRos, and Alexa Fluor 488
Observe the fluorescence emission from a culture of albino Swiss mouse embryo cells (3T3 line) stained with MitoTracker Red CMXRos, Alexa Fluor 488 conjugated to phalloidin, and DAPI, which target the intracellular mitochondrial network, cytoskeletal actin filaments, and nucleus, respectively. Note the presence of high signal levels from all three of the fluorophores employed to stain the specimen.
Rat Tongue Muscle Tissue with Rhodamine, DAPI, and Alexa Fluor 488
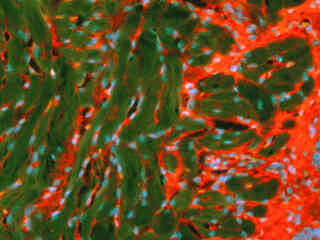
Fluorescence emission intensity from a thin section of rat tongue muscle tissue stained for DNA and glycoproteins with DAPI and tetramethylrhodamine (TMR) conjugated to wheat germ agglutinin, respectively. In addition, the specimen was simultaneously labeled with Alexa Fluor 488 conjugated to phalloidin (targeting the actin network; green emission). Note the presence of both overlapping and discrete signals from all three of these fluorophores, which combine to form an image reminiscent of a brightfield stain.
Normal Human Lung Cells with Cy2, DAPI, and Alexa Fluor 546
A culture of normal human lung cells (MRC-5 line) was immunofluorescently labeled with primary anti-ATPase inhibitor protein mouse monoclonal antibodies followed by goat anti-mouse Fab fragments conjugated to Cy2. The visible light absorption maximum of Cy2 is 489 nanometers and the emission maximum occurs at 506 nanometers. In addition, the specimen was simultaneously stained with DAPI (targeting DNA in the cell nucleus; blue emission) and Alexa Fluor 546 conjugated to phalloidin (targeting the cytoskeletal actin network; yellow-orange emission). Note the presence of green mitochondria in this specimen.
Bovine Pulmonary Artery Endothelial Cells with DAPI, BODIPY FL, and MitoTracker Red CMXRos

Examine the bright fluorescence emission intensity from a culture of bovine pulmonary artery endothelial cells stained with MitoTracker Red CMXRos, BODIPY FL conjugated to phallacidin, and DAPI, which target the intracellular mitochondrial network, cytoskeletal actin filaments, and nucleus, respectively. These combined probes all exhibit high signal levels with the Nikon DAPI-FITC-Texas Red triple band excitation filter combination.
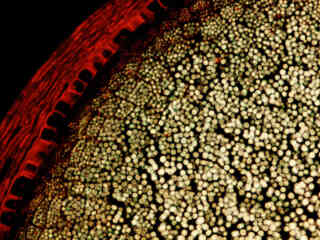
Rabbit Bone Marrow Tissue with DAPI, Oregon Green 488, and Alexa Fluor 546
A thin section of rabbit bone marrow tissue was stained for DNA and glycoproteins with DAPI and Oregon Green 488 conjugated to wheat germ agglutinin, respectively. The visible light absorption maximum of Oregon Green is 496 nanometers and the emission maximum occurs at 524 nanometers. In addition, the specimen was simultaneously labeled with Alexa Fluor 546 conjugated to phalloidin (targeting the actin network; yellow-orange emission).
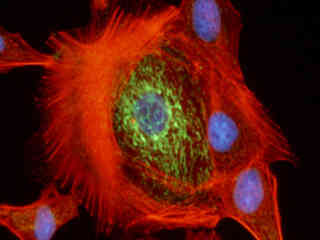
Rat Kangaroo Kidney Cells with Cy2, MitoTracker Red CMXRos, and DAPI
A culture of rat kangaroo kidney epithelial (PtK2 line) cells was immunofluorescently labeled with primary anti-cytokeratin mouse monoclonal antibodies followed by goat anti-mouse Fab fragments conjugated to Cy2. Note the prominent staining of the cytokeratin network throughout the cytoplasm in these cells. In addition, the specimen was simultaneously stained for DNA with the ultraviolet-absorbing probe DAPI, and for the mitochondrial network with MitoTracker Red CMXRos.
Albino Swiss Mouse Embryo Cells with Oregon Green 488, Alexa Fluor 568, and DAPI
Examine the fluorescence emission intensity from a culture of albino Swiss mouse embryo cells (3T3 line) stained with wheat germ agglutinin conjugated to Oregon Green 488, Alexa Fluor 568 conjugated to phalloidin, and DAPI, which target the intracellular Golgi network, cytoskeletal actin filaments, and nucleus, respectively. Note the presence of high signal levels from all three of the fluorophores employed to stain the specimen.
African Green Monkey Kidney Cells with DAPI, MitoTracker Red CMXRos, and Alexa Fluor 488
Observe the fluorescence emission from a culture of normal African green monkey kidney cells (CV-1 line) stained with MitoTracker Red CMXRos, Alexa Fluor 488 conjugated to phalloidin, and DAPI, which target the intracellular mitochondrial network, cytoskeletal actin filaments, and nucleus, respectively. Note the presence of high signal levels from all three of the fluorophores employed to stain the specimen, as well as the unusual morphology of these cells.
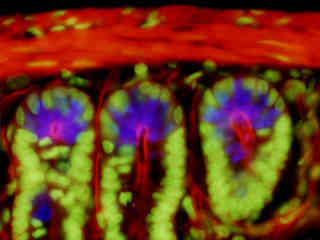
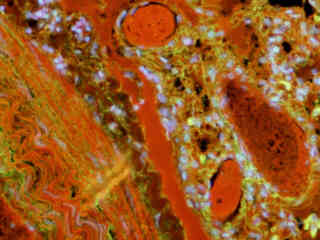
Human Small Intestine Section with DAPI, Texas Red, and Alexa Fluor 488
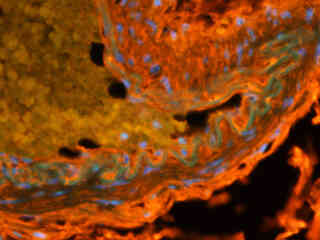
A thin section of human small intestine tissue was stained for DNA and glycoproteins with DAPI and Texas Red conjugated to wheat germ agglutinin, respectively. The visible light absorption maximum of Texas Red is 596 nanometers and the emission maximum occurs at 615 nanometers. In addition, the specimen was simultaneously labeled with Alexa Fluor 488 conjugated to phalloidin (targeting the actin network; green emission). Note the presence of both overlapping and discrete signals from all three of these fluorophores.
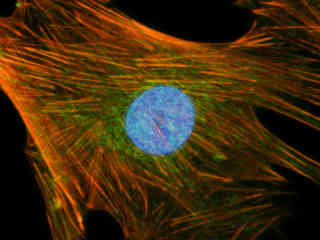
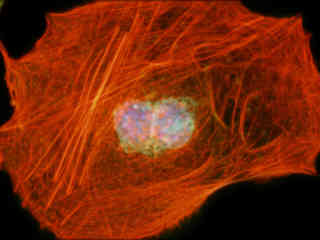
Bovine Pulmonary Artery Endothelial Cells with DAPI, Alexa Fluor 488, and Cy3
Examine the fluorescence emission from a culture of bovine pulmonary artery endothelial cells that were immunofluorescently labeled with primary anti-vinculin mouse monoclonal antibodies followed by goat anti-mouse Fab fragments conjugated to Cy3. The visible light absorption maximum of Cy3 is 552 nanometers and the emission maximum occurs at 570 nanometers. Note the prominent staining of the cellular attachment network in the central portion and periphery of these cells. In addition, the specimen was simultaneously stained for DNA with the ultraviolet-absorbing probe DAPI, and for the cytoskeletal filamentous actin network with Alexa Fluor 488 conjugated to phalloidin.
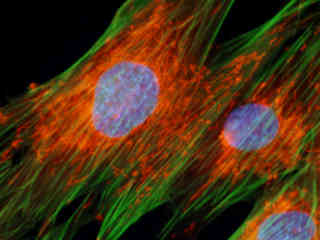
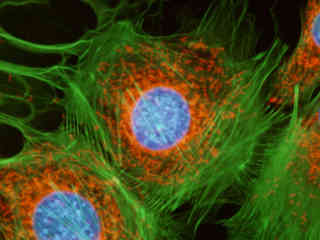
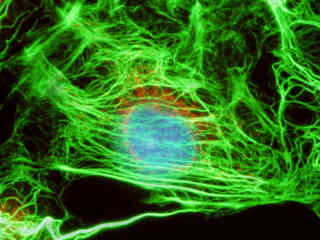
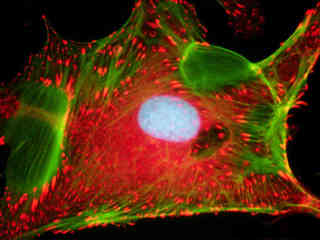
Indian Muntjac Deerskin Fibroblast Cells with DAPI, MitoTracker Red CMXRos, and Alexa Fluor 488

A culture of Indian Muntjac deerskin fibroblast cells was stained with MitoTracker Red CMXRos and Alexa Fluor 488, which target the intracellular mitochondrial network and cytoskeletal actin filaments, respectively. In addition, the specimen was simultaneously stained with DAPI (targeting DNA in the cell nucleus; ultraviolet excitation and blue emission). Note the presence of high signal levels from the blue (DAPI) fluorophore, as well as the orange-red fluorescence exhibited by the tubular mitochondria and the green emission from actin filaments in the cytoplasm.
Contributing Authors
Related Nikon Products
Share this article:


