Blue Excitation: B-2E/C (Bandpass Emission)
The Nikon B-2E/C fluorescence filter set is designed as a high-performance combination with a medium-width excitation bandpass (30 nanometers) in order to provide a high signal-to-noise ratio in conjunction with a slightly lowered emission bandpass region compared to the B-1E and B-2E sets. Ultraviolet, visible, and near-infrared transmission spectral profiles for this filter combination are illustrated below in Figure 1. The bandpass emission filter has a center wavelength of 535 nanometers (40-nanometer bandpass), and in similarity to the other filter combinations in this group, the B-2E/C set employs a longpass dichromatic mirror with a cut-on wavelength of 505 nanometers.
Figure 1 - B-2E/C (Medium Band Blue Excitation)
Blue Excitation Filter Block B-2E/C Specifications
- Excitation Filter Wavelengths: 465-495 nanometers (bandpass, 480 CWL)
- Dichromatic Mirror Cut-on Wavelength: 505 nanometers (longpass, LP)
- Barrier Filter Wavelengths: 515-555 nanometers (bandpass, 535 CWL)
The B-2E/C filter combination is specifically designed with a 30-nanometer excitation bandpass suitable for imaging specimens labeled with fluorescein isothiocyanate (FITC), and a number of other popular fluorophores used in multiple-labeling fluorescence techniques. The emission bandpass region is somewhat lower in wavelength than that of the B-1E and B-2E filter sets to provide optimum detection of popular fluorochromes such as FITC, BODIPY, Fluo-3, oxacarbocyanine dyes (DiO), and green fluorescent protein (GFP). In addition, the lowered emission filter bandpass results in improved blocking of yellow to red wavelengths, with only green fluorescence appearing in images acquired using the B-2E/Cfilter combination (See Figure 2). Among the Nikon blue-excitation filter sets, those in the E-series, in general, produce images with a much higher signal-to-noise ratio and darker background regions than do combinations with longpass emission filters.
The B-2E/C filter set is recommended when investigating the following fluorophores: Acridine Orange bound to DNA (excludes detection of Acridine Orange bound to RNA), Acridine Yellow, Alexa Fluor 488, Auramine O, BODIPY probes, Calcein, Calcium Green, carboxyfluorescein (FAM), coriphosphine O, Cy2, DiO probes, enhanced green and yellow fluorescent proteins (EGFP and EYFP), red-shifted green fluorescent protein (rsGFP), Fluo-3 and similar ratiometric dyes, FITC, LysoTracker derivatives, MitoTracker Green, Oregon Green derivatives, Rhodamine 123 (and similar xanthenes), Spectrum Green, SYTO probes, SYTOX Green, YO-PRO 1, and YOYO 1. The images presented in Figure 2 demonstrate the performance of this filter combination with a variety of blue-absorbing fluorescence probes targeted at different intracellular locations.
Figure 2 - Nikon B-2E/C Medium Band Excitation Bandpass Filter Set
Presented in Figure 2(a) is the fluorescence emission intensity from a culture of rat kangaroo (PtK2) epithelial cells that were immunofluorescently labeled with primary anti-bovine alpha-tubulin mouse monoclonal antibodies followed by goat anti-mouse Fab fragments conjugated to Alexa Fluor 488. The absorption maximum of Alexa Fluor 488 is 495 nanometers and the emission maximum occurs at 519 nanometers. Note the prominent staining of the intracellular microtubule network that extends throughout the cytoplasm. Green fluorescence from the nuclei stained with SYTOX Green in a thin section of mouse intestine is illustrated in Figure 2(b). The specimen was also simultaneously stained with Alexa Fluor 568 phalloidin (filamentous actin; 600 nanometer emission) and Alexa Fluor 350 wheat germ agglutinin (mucus of goblet cells; 346 nanometer excitation and 442 nanometer emission). Note the presence of clean signal (low background) from the green fluorophore, but the absence of fluorescence intensity from the blue and red probes.
Figure 2(c) illustrates a culture of Indian Muntjac cells that were labeled with phalloidin conjugated to Alexa Fluor 488 for the intracellular actin cytoskeletal network. The specimen was simultaneously labeled with primary anti-human OxPhos Complex V inhibitor protein mouse monoclonal antibodies followed by goat anti-mouse Fab fragments conjugated to Alexa Fluor 555 (emission maximum at 571 nanometers). Nuclei were stained with the far-red fluorescent probe TO-PRO-3 (emission maximum at 661 nanometers). Note the absence of signals from the orange (Alexa Fluor 555) and far-red fluorophores, but the presence of intense green fluorescence from several of the more prominent actin cytoskeletal elements.
A thin section of mouse kidney tissue, labeled with DAPI, Alexa Fluor 488, and Alexa Fluor 568 is presented in Figure 2(d). In this image, fluorescence signal from the blue and red fluorophores is suppressed by the bandpass filter in the B-2E/C filter combination to yield a sharp, crisp image of the glomeruli and convoluted tubules. Bright green nuclei from a culture of Indian Muntjac cells that were labeled with SYTOX Green to stain chromatin are illustrated in Figure 2(e). Although the cytoskeletal network was heavily stained with phalloidin conjugated to Alexa Fluor 568 in this specimen, the fluorescence image is devoid of red emission. Finally, autofluorescence in plant tissues (caster bean tissue section) is represented in Figure 2(f), and demonstrates the bright green emission spectrum of endogenous fluorophores in these specimens. Note that images captured with the B-2E/Cfilter combination exhibit far less background fluorescence than any of the longpass sets (B-1A, B-2A, and B-3A) and higher signal levels than the B-1E bandpass emission set.
Additional Specimen Images with the B-2E/C Filter Combination
Rat Kangaroo Cell Tubulin
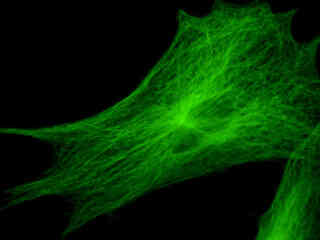
Fluorescence emission intensity from a culture of rat kangaroo (PtK2) epithelial cells that were immunofluorescently labeled with primary anti-bovine alpha-tubulin mouse monoclonal antibodies followed by goat anti-mouse Fab fragments conjugated to Alexa Fluor 488.
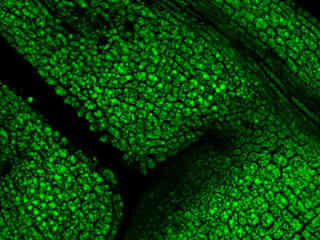
Mouse Intestine Thin Section
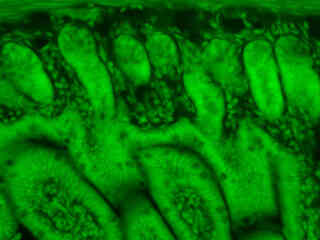
Fluorescence emission intensity from a thin section of mouse intestine stained with Alexa Fluor 350 wheat germ agglutinin, a blue fluorescent lectin that is specific to the mucus of goblet cells.
Indian Muntjac Cell Actin
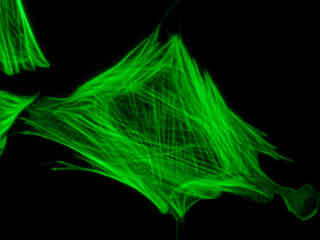
Fluorescence emission intensity from a culture of Indian Muntjac cells that were labeled with phalloidin conjugated to Alexa Fluor 488 for the intracellular actin cytoskeletal network.
Mouse Kidney Tissue
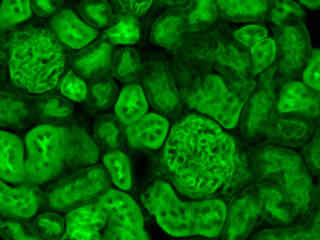
Fluorescence emission intensity from a thin section of mouse kidney stained with multiple (3) fluorophores.
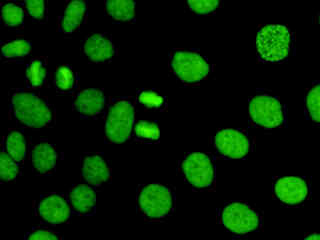
Indian Muntjac Nuclei
Fluorescence emission intensity from a culture of Indian Muntjac cells that were labeled with SYTOX Green to stain chromatin in the nuclei.
Caster Bean Thin Section
Autofluorescence emission intensity from a thin section of caster bean (Ricinus communis) tissue.
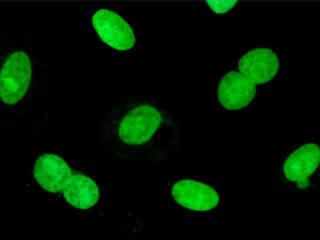
HeLa Cell Histones
HeLa cells were immunofluorescently labeled with primary anti-histone (pan) mouse monoclonal antibodies followed by goat anti-mouse Fabfragments conjugated to fluorescein. The absorption maximum of fluorescein is 494 nanometers and the emission maximum occurs at 519 nanometers (in the green region of the visible light spectrum). The primary antibody, produced from purified nuclear fractions of HeLa cells, binds specifically to an antigen determinant that is present on all five histone proteins (H1, H2A, H2B, H3, and H4).
Contributing Authors
Related Nikon Products
Share this article:


