Violet Excitation: V-1A (Longpass Emission)
The Nikon V-1A violet excitation fluorescence filter set is designed with a very narrow excitation passband width of only 10 nanometers to minimize autofluorescence. Ultraviolet and visible transmission spectral profiles for this filter combination are illustrated below in Figure 1. The longpass barrier filter, with a cut-on wavelength 5 nanometers greater than the dichromatic mirror value, passes all emission wavelengths above 435 nanometers, allowing detection of a wide range of fluorochromes having fluorescence emission in the blue, green, and red spectral regions.
Figure 1 - V-1A (Narrow Band Violet Excitation)
Violet Excitation Filter Block V-1A Specifications
- Excitation Filter Wavelengths: 400-410 nanometers (bandpass, 405 CWL)
- Dichromatic Mirror Cut-on Wavelength: 430 nanometers (longpass, LP)
- Barrier Filter Wavelengths: 435 nanometer cut-on (longpass, LP)
The V-1A fluorescence filter set is designed to perform with a wide range of popular fluorochromes excited with violet wavelengths, and can be considered a general purpose combination for use where autofluorescence must be limited in comparison to that observed with the standard violet filter block. For appropriate fluorophores, the narrow 10-nanometer excitation bandpass (encompassing the mercury arc-discharge lamp h-line at 404 nanometers) significantly reduces autofluorescence, with only a minimal reduction in overall brightness. The V-1A filter combination is specifically recommended when studying the following fluorophores: beta-lactamase (non-ratiometric), Cascade Yellow, catecholamine, CCF2 (GeneBLAzer, formaldehyde-induced fluorescence (FIF), gloxalic acid, hydroxypyrene trisulfonic acid (HPTS), Pacific Blue, pyronine, serotonin, Spectrum Blue, and tetracycline. The images presented in Figure 2 demonstrate the performance of this filter combination with a variety of violet absorbing fluorescent probes targeted at different intracellular locations.
Figure 2 - Nikon V-1A Narrow Band Violet Excitation Longpass Filter Set
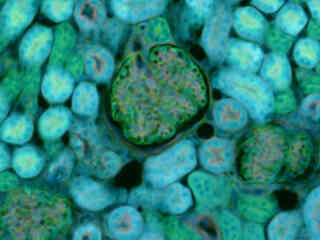
Illustrated in Figure 2(a) is the fluorescence emission intensity from a thin section of mouse kidney stained with DAPI, Alexa Fluor 488 wheat germ agglutinin, a green fluorescent lectin that is specific to the glomeruli and convoluted tubules. The absorption maximum of DAPI is 358 nanometers and the emission maximum is 461 nanometers. In addition, the specimen was simultaneously stained with Alexa Fluor 568 phalloidin (filamentous actin). Note the presence of spectral bleed-through from the red and green fluorophores, which appears throughout the image.
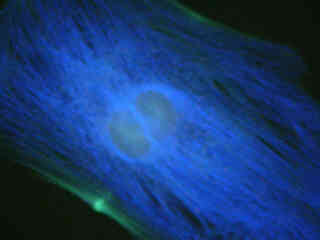
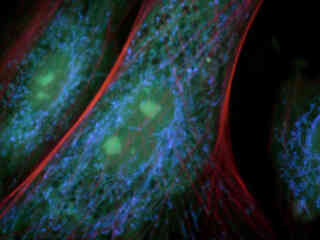
Figures 2(b) and 2(c) demonstrate emission intensity from a culture of Indian Muntjac deerskin fibroblast cells that were immunofluorescently labeled with either primary anti-bovine alpha-tubulin (Figure 2(b)) or anti-oxphos complex V inhibitor protein (Figure 2(c)) mouse monoclonal antibodies followed by goat anti-mouse Fab fragments conjugated to Pacific Blue. The absorption maximum of Pacific Blue is 410 nanometers and the emission maximum occurs at 455 nanometers. Note the prominent staining of the intracellular microtubule (Figure 2(b)) and mitochondrial (Figure 2(c)) networks that extend throughout the cytoplasm in these specimens.
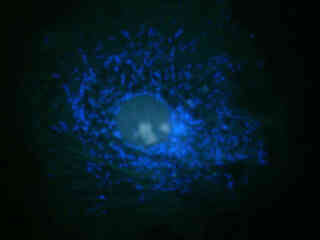
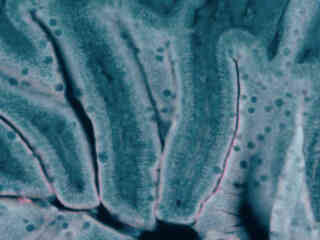
Autofluorescence in plant tissues (fern tissue section) is represented in Figure 2(f), and demonstrates the wide emission spectrum of endogenous fluorophores in these specimens. Note that images captured with the V-1A filter combination exhibit more background fluorescence than the blue fluorescent protein (BFP) set, but less emission intensity than the related combination in the V-2A filter block.
Additional Specimen Images with the V-1A Filter Combination
Mouse Kidney Tissue
Fluorescence emission intensity from a thin section of mouse kidney stained with multiple fluorophores.
Indian Muntjac Tubulin
Fluorescence emission intensity from a culture of fibroblast Indian Muntjac deerskin cells that were immunofluorescently labeled with primary anti-bovine alpha-tubulin mouse monoclonal antibodies followed by goat anti-mouse Fab fragments conjugated to Pacific Blue.
Indian Muntjac Mitochondria
Fluorescence emission intensity from a culture of fibroblast Indian Muntjac deerskin cells that were immunofluorescently labeled with primary anti-oxphos complex V inhibitor protein monoclonal antibodies (mouse) followed by goat anti-mouse Fab fragments conjugated to Pacific Blue.
Rat Thoracic Aorta Cellular Mitochondria
Fluorescence emission intensity from a culture of rat thoracic aorta (muscle) cells that were immunofluorescently labeled with primary anti-oxphos complex V inhibitor protein monoclonal antibodies (mouse) followed by goat anti-mouse Fab fragments conjugated to Pacific Blue.
Contributing Authors
Related Nikon Products
Share this article:


