Blue Excitation: B-2E (Bandpass Emission)
Ultraviolet, visible, and near-infrared transmission spectra for the Nikon B-2E filter combination are illustrated below in Figure 1. This filter set is designed with a wide excitation bandpass (40 nanometers) in order to provide a relatively high signal-to-noise ratio with an adequate spectral absorption and excitation profile for most fluorophores responding to blue wavelengths. The bandpass emission filter has a center wavelength of 540 nanometers (40-nanometer bandpass), and in similarity to the other filter combinations in this group, the B-2Eset employs a longpass dichromatic mirror, which has a cut-on wavelength of 505 nanometers.
Figure 1 - B-2E (Medium Band Blue Excitation)
Blue Excitation Filter Block B-2E Specifications
- Excitation Filter Wavelengths: 450-490 nanometers (bandpass, 470 CWL)
- Dichromatic Mirror Cut-on Wavelength: 505 nanometers (longpass, LP)
- Barrier Filter Wavelengths: 520-560 nanometers (bandpass, 540 CWL)
The B-2E filter combination is specifically designed with a wide excitation passband suitable for imaging specimens labeled with fluorescein isothiocyanate (FITC) and derivatives, in addition to providing sufficient excitation energy to enhance emission (relative to the B-1Eset) from a range of fluorochromes with similar absorption characteristics. In order to exclude crossover from yellow, orange, and red wavelengths, the filter set incorporates a bandpass barrier filter that is identical to that included in the B-1E set, but with a longer bandpass center wavelength than that of the B-2E/C combination. Among the Nikon blue excitation filter sets, those in the E series, in general, produce images with a much higher signal-to-noise ratio than do combinations with longpass emission filters (the A filter category). In addition, the image background regions appear significantly darker with the bandpass filter combinations. Fluorescence emission occurring at longer wavelengths than green (the yellow, orange, and red spectral regions) is excluded from images collected using the B-2E filter combination (as illustrated in Figure 2).
The B-2E filter set is recommended when investigating the following fluorophores: Acridine Orange-DNA (excludes detection of Acridine Orange-RNA), Acridine Yellow, Alexa Fluor 488, BODIPY probes, Calcein, Calcium Green, carboxyfluorescein (FAM), Cy2, DiO probes, enhanced green and yellow fluorescent proteins (EGFP and EYFP), red-shifted green fluorescent protein (RsGFP), FITC, LysoTracker derivatives, MitoTracker Green, Oregon Green, Rhodamine 123 (and related xanthenes), Spectrum Green, SYTO probes, SYTOX Green, YO-PRO 1, and YOYO 1. The images presented in Figure 2 demonstrate the performance of this filter combination with a variety of blue light absorbing fluorescence probes targeted at different intracellular locations.
Figure 2 - Nikon B-2E Medium Band Blue Excitation Bandpass Filter Set
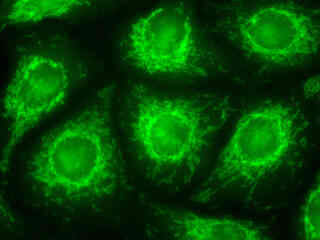
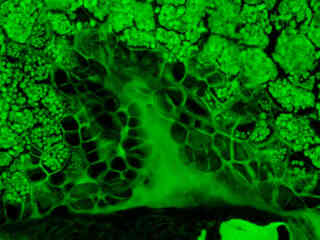
Presented in Figure 2(a) is the fluorescence emission intensity from a culture of rat kangaroo (PtK2) epithelial cells that were immunofluorescently labeled with primary anti-bovine alpha-tubulin mouse monoclonal antibodies followed by goat anti-mouse Fab fragments conjugated to Alexa Fluor 488. Note the prominent staining of the intracellular microtubule network that extends throughout the cytoplasm. A thin section of mouse kidney stained with multiple fluorophores is illustrated in Figure 2(b). Nuclei in the tissue section were targeted with the nucleic acid probe DAPI, which has an excitation maximum at 358 nanometers and an emission maximum at 461 nanometers when bound to DNA in cell cultures and tissue sections. In addition, the cryostat section was also simultaneously stained with Alexa Fluor 488 wheat germ agglutinin (glomeruli and convoluted tubules) and Alexa Fluor 568 phalloidin (filamentous actin and the brush border). Note the absence of signal from both the red (Alexa Fluor 568) and blue (DAPI) fluorophores.
Fluorescence emission intensity from a culture of Indian Muntjac cells that were labeled with phalloidin conjugated to Alexa Fluor 488 for the intracellular actin cytoskeletal network is presented in Figure 2(c). The absorption maximum of Alexa Fluor 488 is 495 nanometers and the emission maximum occurs at 519 nanometers. In addition, the specimen was simultaneously labeled with primary anti-human OxPhos Complex V inhibitor protein mouse monoclonal antibodies followed by goat anti-mouse Fab fragments conjugated to Alexa Fluor 555 (emission maximum at 571 nanometers). Nuclei were stained with the far-red fluorescent probe TO-PRO-3 (emission maximum at 661 nanometers). Note the absence of signals from the orange (Alexa Fluor 555) and far-red fluorophores, but the presence of intense green fluorescence from several of the more prominent actin cytoskeletal elements.
A thin section of mouse intestine stained with Alexa Fluor 350 wheat germ agglutinin, a blue fluorescent lectin that is specific to the mucus of goblet cells, is depicted in Figure 2(d). The ultraviolet absorption maximum of Alexa Fluor 350 is 346 nanometers and the emission maximum is 442 nanometers, which hinders the ability to image the dye with blue excitation filter combinations. In addition, the specimen was simultaneously stained with Alexa Fluor 568 phalloidin (filamentous actin; 600 nanometer emission) and SYTOX Green (nuclei; 504 nanometer excitation and 523 nanometer emission). Note the presence of clean signal (low background) from the green fluorophore, but the absence of fluorescence intensity from the blue and red probes.
HeLa epithelial cells that were immunofluorescently labeled with primary anti-oxphos complex V inhibitor protein monoclonal antibodies (mouse) followed by goat anti-mouse Fabfragments conjugated to Alexa Fluor 488 are presented in Figure 2(e). In addition, the specimen was simultaneously stained for F-actin with Alexa Fluor 568 (red) conjugated to phalloidin, and for DNA with 4',6-diamidino-2-phenylindole (DAPI). Note the absence of signal from both the red and blue fluorophores, but the presence of significant emission intensity from Alexa Fluor 488, which is very efficiently excited in the blue wavelength region. Finally, autofluorescence emission intensity from a thin section of wheat grain (Triticum aestivum) tissue is demonstrated in Figure 2(f). Endogenous autofluorescence in plant tissues arises from a variety of biomolecules, including chlorophyll, carotene, and xanthophyll. In the blue region, chlorophyll has an absorption band with a high extinction coefficient and produces a significant amount of fluorescence when excited with wavelengths between 420 and 460 nanometers. Note the absence of spectral bleed-through from autofluorescence emission in the yellow and red spectral regions with the B-2E filter combination.
Additional Specimen Images with the B-2E Filter Combination
Rat Kangaroo Cell Tubulin
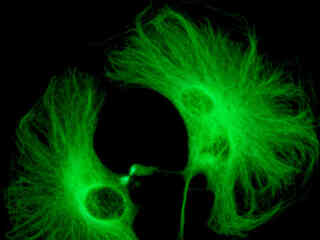
Fluorescence emission intensity from a culture of rat kangaroo (PtK2) epithelial cells that were immunofluorescently labeled with primary anti-bovine alpha-tubulin mouse monoclonal antibodies followed by goat anti-mouse Fab fragments conjugated to Alexa Fluor 488.
Mouse Kidney Tissue
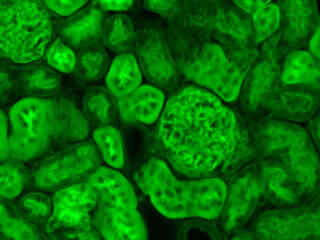
Fluorescence emission intensity from a thin section of mouse kidney stained with multiple (3) fluorophores. Nuclei in the tissue section were targeted with the nucleic acid probe DAPI, which has an excitation maximum at 358 nanometers and an emission maximum at 461 nanometers when bound to DNA in cell cultures and tissue sections.
Indian Muntjac Cell Actin
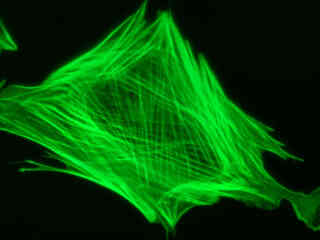
Fluorescence emission intensity from a culture of Indian Muntjac cells that were labeled with phalloidin conjugated to Alexa Fluor 488 for the intracellular actin cytoskeletal network.
Mouse Intestine Thin Section
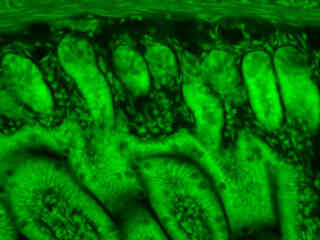
Fluorescence emission intensity from a thin section of mouse intestine stained with Alexa Fluor 350 wheat germ agglutinin, a blue fluorescent lectin that is specific to the mucus of goblet cells.
Contributing Authors
Related Nikon Products
Share this article:


