Green Excitation: G-2A (Longpass Emission)
The Nikon G-2A filter set is designed as the standard combination for use with green excitation wavelengths, and employs a wide (50-nanometer) excitation passband that covers essentially the entire green spectral region, from 510 to 560 nanometers. Ultraviolet, visible, and near-infrared transmission spectral profiles for this filter combination are illustrated below in Figure 1. Combined with the 590-nanometer cut-on wavelength of the longpass emission filter, the G-2A set enables detection of a wide range of fluorochromes emitting at wavelengths longer than those in the yellow region and extending into the near-infrared spectral zone. The dichromatic mirror has a cut-on wavelength specification of 565 nanometers.
Figure 1 - G-2A (Wide Band Excitation)
Green Excitation Filter Block G-2A Specifications
- Excitation Filter Wavelengths: 510-560 nanometers (bandpass, 535 CWL)
- Dichromatic Mirror Cut-on Wavelength: 565 nanometers (longpass, LP)
- Barrier Filter Wavelengths: 590 nanometer cut-on (longpass, LP)
The G-2A filter combination is designed to perform with a wide range of fluorochromes excited by green wavelengths, and is considered the standard Nikon filter block for green excitation. The combination of a wide excitation passband (50 nanometers) with a longpass emission (barrier) filter enables detection of fluorescence intensity from a substantial range of fluorophores that emit in the orange through near-infrared spectral regions (restricted to wavelengths longer than the 590-nanometer barrier filter cut-on wavelength). The resulting images are bright, although signal-to-noise ratios are typically lower than those produced with combinations employing bandpass barrier filters (such as the G-2E/C and Cy3). The G-2A set is recommended when studying the following fluorophores: Acridine Red, Alexa Fluors (532, 546, 555, 568, and 594), Alizarin Red, BODIPY probes, Calcium Orange, Cy3, Cy3.1.8, ethidium bromide, FluoroRuby, FM 5-95, hexachlorofluorescein (HEX), LDS 751-DNA, MitoTracker Orange and Red, POPO-3, PO-PRO-3, propidium iodide (PI), Pyronin B, RedoxSensor Red CC-1, RH probes (237, 414, 421, 795), many rhodamine derivatives, Sevron Brilliant Red, SYTO derivatives, SYTOX Orange, and Xylene Orange. The images presented in Figure 2 demonstrate the performance of this filter combination with a variety of green-absorbing fluorescence probes targeted at different intracellular locations.
Figure 2 - Nikon G-2A Green Excitation Longpass Filter Set
Illustrated in Figure 2(a) is the fluorescence emission from a stressed culture of Indian Muntjac deerskin fibroblast cells adherent on a cover glass. Nuclei in the cells were targeted with the nucleic acid probe SYTOX Green. In addition, the cells were stained with LysoTracker Red DND-99 (targeting lysosomes; excitation at 577 nanometers and emission at 590 nanometers) and Alexa Fluor 350 conjugated to phalloidin (targeting actin; excitation at 346 nanometers and emission at 442 nanometers). Note the absence of significant emission intensity from the blue and green fluorophores, but the high level of fluorescence from lysosomes that surround the nucleus.
A culture of rat thoracic aorta (muscle) cells that were immunofluorescently labeled with primary anti-desmin (an intermediate filament protein) mouse monoclonal antibodies followed by goat anti-mouse Fab fragments conjugated to Alexa Fluor 546 is presented in Figure 2(b). The absorption maximum of Alexa Fluor 546 is 556 nanometers and the emission maximum occurs at 573 nanometers. In addition, the specimen was simultaneously stained for F-actin with Alexa Fluor 350 (blue) conjugated to phalloidin, and for DNA with SYTOX Green. Note the absence of signal from both the blue and green fluorophores, but the high level of orange-red fluorescence intensity from the labeled desmin. The longpass emission G-1A filter combination displays a higher degree of background signal (red in the image above) than do the related Nikon bandpass emission filter sets, G-2E/C and Cy3.
Fluorescence emission from a thin section of mouse intestine stained with Alexa Fluor 350 wheat germ agglutinin, a blue fluorescent lectin that is specific to the mucus of goblet cells is illustrated in Figure 2(c). In addition, the specimen was simultaneously stained with Alexa Fluor 568 phalloidin (filamentous actin; 600 nanometer emission) and SYTOX Green (nuclei; 504 nanometer excitation and 523 nanometer emission). Note the higher level of background noise in comparison to the Nikon bandpass filter combinations (G-2E/C and Cy3), and the significant amount of orange-red signal arising from Alexa Fluor 568 that appears in the image.
Bovine pulmonary artery endothelial cells stained with MitoTracker Red CMXRos, which targets the intracellular mitochondrial network, are displayed in Figure 2(d). The absorption maximum of MitoTracker Red CMXRos is 579 nanometers and the emission maximum occurs at 599 nanometers. In addition, the specimen was simultaneously stained with DAPI (targeting DNA in the cell nucleus; blue emission) and BODIPY FL-phallacidin (targeting actin; green emission). Note the absence of signal from the blue (DAPI) and green (BODIPY) fluorophores, but the bright orange-red fluorescence exhibited by the tubular mitochondria.
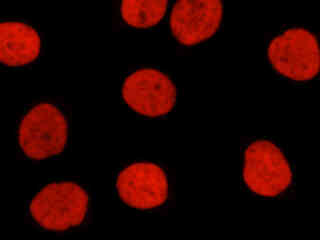
Figure 2(e) illustrates a culture of HeLa cells that were immunofluorescently labeled with primary anti-histone (pan) mouse monoclonal antibodies followed by goat anti-mouse Fabfragments conjugated to Alexa Fluor 546. The primary antibody, produced from purified nuclear fractions of HeLa cells, binds specifically to an antigen determinant that is present on all five histone proteins (H1, H2A, H2B, H3, and H4). Note the strong orange-red fluorescence intensity from the interphase nuclei.
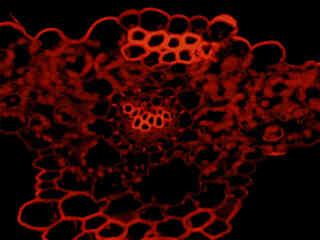
Autofluorescence emission intensity from a fern (Holly; Cyrtomium caryotideum) sorus indusium is demonstrated in Figure 2(f). Endogenous autofluorescence in plant tissues arises from a variety of biomolecules, including chlorophyll, carotene, and xanthophyll. In the green excitation region, chlorophyll has an absorption band with a low extinction coefficient, but still produces a detectable level of fluorescence at emission wavelengths of 550 nanometers and above (green, yellow, orange, and red). For the fern thin section illustrated above, note the presence of autofluorescence emission intensity in the orange and red spectral regions.
Additional Specimen Images with the G-2A Filter Combination
Indian Muntjac Cells with LysoTracker Red
Fluorescence emission intensity from a stressed culture of Indian Muntjac deerskin fibroblast cells adherent on a cover glass.
Rat Thoracic Aorta Cell Intermediate Filaments
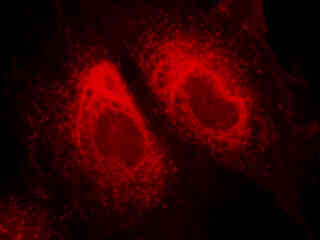
Fluorescence emission produced from a culture of rat thoracic aorta (muscle) cells that were immunofluorescently labeled with primary anti-desmin (an intermediate filament protein) mouse monoclonal antibodies followed by goat anti-mouse Fab fragments conjugated to Alexa Fluor 546.
Mouse Intestine Thin Section
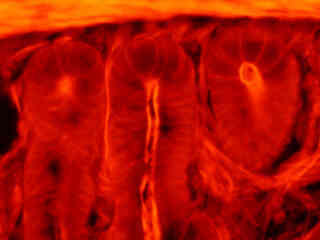
Fluorescence emission intensity from a thin section of mouse intestine stained with Alexa Fluor 350 wheat germ agglutinin, a blue fluorescent lectin that is specific to the mucus of goblet cells.
Bovine Pulmonary Artery Cell Mitochondria
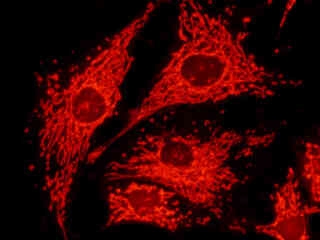
Fluorescence emission intensity from a culture of bovine pulmonary artery endothelial cells stained with MitoTracker Red CMXRos, which targets the intracellular mitochondrial network.
Contributing Authors
Related Nikon Products
Share this article:


