Green Excitation: G-2B (Longpass Emission)
The Nikon G-2B filter set is a variation of the standard combination for use with green excitation wavelengths, and employs a wide (50 nanometers) excitation passband covering essentially the entire green spectral region, from 510 to 560 nanometers. Ultraviolet, visible, and near-infrared transmission spectral profiles for the Nikon G-2B filter combination are illustrated below in Figure 1. The filter components are similar to those of the G-2A set, except that the dichromatic mirror cut-on wavelength is shifted to longer wavelengths by 10 nanometers (to 575 nanometers), and the emission filter cut-on is shifted 20 nanometers toward the red, to 610 nanometers. The G-2B combination is applicable with a wide range of fluorophores excited by green wavelengths, with emission occurring in the orange through near-infrared regions.
Figure 1 - G-2B (Wide Band Green Excitation)
Green Excitation Filter Block G-2B Specifications
- Excitation Filter Wavelengths: 510-560 nanometers (bandpass, 535 CWL)
- Dichromatic Mirror Cut-on Wavelength: 575 nanometers (longpass, LP)
- Barrier Filter Wavelengths: 610 nanometer cut-on (longpass, LP)
The G-2B filter combination is designed to perform as a standard green excitation filter combination, producing bright images from a wide range of fluorochromes, but with darker backgrounds than those obtained with the G-2A set (due to the different dichromatic mirror and emission filter cut-on wavelengths). In addition, the 20-nanometer red shift of the emission filter cut-on excludes more yellow-orange signal, resulting in images that are more reddish visually compared to those from the G-2A filter set. The G-2B set is recommended when studying the following fluorophores: Acridine Red, Alexa Fluors (555, 568, and 594), dichlorodimethoxyfluorescein (JOE), Alizarin Red, BODIPY probes, Calcium Orange, Cy3, Cy3.1.8, dioctadecyl tetramethylindocarbocyanine (DiI), ethidium bromide, FluoroRuby, LDS 751-DNA, MitoTracker Red, R and B-phycoerythrin, POPO-3, PO-PRO-3, propidium iodide (PI), Pyronin B, RedoxSensor Red CC-1, RH probes (237, 414, 421, 795), many rhodamine derivatives, Sevron Brilliant Red, and several SYTO derivatives. The images presented in Figure 2 demonstrate the performance of this filter combination with a variety of green-absorbing fluorescence probes targeted at different intracellular locations.
Figure 2 - Nikon G-2B Green Excitation Longpass Emission Filter Set
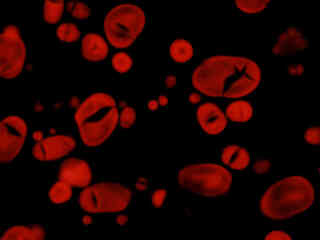
Presented in Figure 2(a) is the fluorescence emission from a culture of African green monkey (COS-1 line) cells stained with MitoTracker Red CMXRos, which targets the intracellular mitochondrial network. The absorption maximum of MitoTracker Red CMXRos is 579 nanometers and the emission maximum occurs at 599 nanometers. In addition, the specimen was simultaneously stained with DAPI (targeting DNA in the cell nucleus; blue emission) and Alexa Fluor 488 conjugated to phalloidin (targeting actin; green emission). Note the absence of signal from the blue DAPI and green fluorophores, but the bright orange-red fluorescence exhibited by the disc-shaped mitochondria.
A thin section of mouse kidney stained with multiple (3) fluorophores is illustrated in Figure 2(b). Nuclei in the tissue section were targeted with the nucleic acid probe DAPI, which has an excitation maximum at 358 nanometers and an emission maximum at 461 nanometers when bound to DNA in cell cultures and tissue sections. In addition, the cryostat section was also simultaneously stained with Alexa Fluor 488 wheat germ agglutinin (glomeruli and convoluted tubules) and Alexa Fluor 568 phalloidin (filamentous actin and the brush border). Note the absence of signal from both the blue (DAPI) and green (Alexa Fluor 488) probes, but the intense red fluorescence due to the presence of Alexa Fluor 568 in the actin and brush border networks.
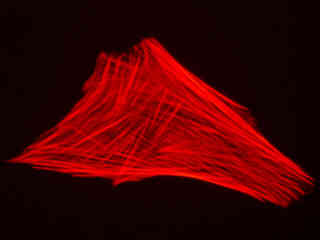
Fluorescence emission intensity from a culture of rat kangaroo (PtK2) epithelial cells that were immunofluorescently labeled with primary anti-bovine alpha-tubulin mouse monoclonal antibodies followed by goat anti-mouse Fab fragments conjugated to Alexa Fluor 546 is demonstrated in Figure 2(c). The absorption maximum of Alexa Fluor 546 is 556 nanometers and the emission maximum occurs at 573 nanometers (in the yellow region of the visible light spectrum). Note the prominent red staining of the intracellular microtubule network that extends throughout the cytoplasm.
HeLa cells that were immunofluorescently labeled with primary anti-histone (pan) mouse monoclonal antibodies followed by goat anti-mouse Fab fragments conjugated to Alexa Fluor 546 are depicted in Figure 2(d). The absorption maximum of Alexa Fluor 546 is 556 nanometers and the emission maximum occurs at 573 nanometers (in the yellow region of the visible light spectrum). The primary antibody, produced from purified nuclear fractions of HeLa cells, binds specifically to an antigen determinant that is present on all five histone proteins (H1, H2A, H2B, H3, and H4). Note the bright red fluorescence from the prophase nucleus.
Fluorescence emission is illustrated in Figure 2(e) from a culture of Indian Muntjac deerskin fibroblast cells stained with Alexa Fluor 532 conjugated to phalloidin, which binds to the intracellular filamentous actin network. The absorption maximum of Alexa Fluor 532 is 531 nanometers and the emission maximum occurs at 554 nanometers in the green-yellow region of the spectrum. In addition, the specimen was simultaneously stained with DAPI (targeting DNA in the cell nucleus; blue emission) and MitoTracker Green FM (targeting mitochondria; green emission). Note the absence of signal from the green (MitoTracker) and blue (DAPI) fluorophores, which are not efficiently excited at green wavelengths, but the bright orange-red fluorescence exhibited by the actin filaments.
Autofluorescence emission intensity from starch grains in a thin section of potato (Solanum tuberosum) tuber tissue is presented in Figure 2(f). Endogenous autofluorescence in plant tissues arises from a variety of biomolecules, including chlorophyll, carotene, and xanthophyll. In the green excitation region, chlorophyll has an absorption band with a low extinction coefficient, but still produces a detectable level of fluorescence at emission wavelengths of 550 nanometers and above (green, yellow, orange, and red). For the starch grains illustrated above, note the presence of autofluorescence emission intensity in the red spectral region.
Additional Specimen Images with the G-2B Filter Combination
African Green Monkey Kidney Cell Mitochondria
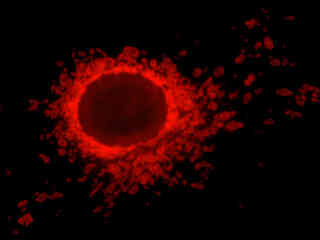
Fluorescence emission intensity from a culture of African green monkey (COS-1 line) cells stained with MitoTracker Red CMXRos, which targets the intracellular mitochondrial network.
Mouse Kidney Tissue
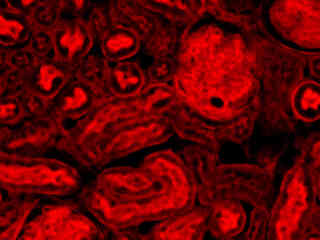
Fluorescence emission intensity from a thin section of mouse kidney stained with multiple (3) fluorophores.
Rat Kangaroo Cell Tubulin
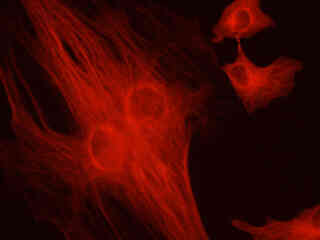
Fluorescence emission intensity from a culture of rat kangaroo (PtK2) epithelial cells that were immunofluorescently labeled with primary anti-bovine alpha-tubulin mouse monoclonal antibodies followed by goat anti-mouse Fab fragments conjugated to Alexa Fluor 546.
HeLa Cell Histones
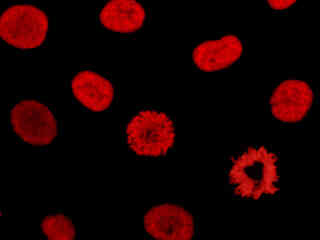
Fluorescence emission intensity from a culture of HeLa cells that were immunofluorescently labeled with primary anti-histone (pan) mouse monoclonal antibodies followed by goat anti-mouse Fab fragments conjugated to Alexa Fluor 546.
Contributing Authors
Related Nikon Products
Share this article:


