Yellow Excitation: Y-2E/C (Bandpass Emission)
Ultraviolet, visible, and near-infrared transmission spectral profiles for the Nikon Y-2E/C filter combination are illustrated below in Figure 1. This filter set is one of two in the Nikon yellow excitation group, both of which employ a bandpass instead of a longpass emission (barrier) filter in order to limit interference from fluorophores emitting outside the band for which the combination is optimized. The 60-nanometer emission window (600-660 nanometers) is combined with a medium 40-nanometer excitation passband (540-580 nanometers) to enable selective excitation and detection of specific popular fluorophores, which are commonly used in multiple labeling experiments. The Y-2E/C filter combination is equipped with a 595-nanometer (cut-on wavelength) longpass dichromatic mirror.
Figure 1 - Y-2E/C (Medium Band Yellow Excitation)
Yellow Excitation Filter Block Y-2E/C Specifications
- Excitation Filter Wavelengths: 540-580 nanometers (bandpass, 560 CWL)
- Dichromatic Mirror Cut-on Wavelength: 595 nanometers (longpass, LP)
- Barrier Filter Wavelengths: 600-660 nanometers (bandpass, 630 CWL)
The Y-2E/C filter combination is optimized for use with the popular fluorescent probes Texas Red and Cy3.5, when they are used alone or in multiple labeling techniques, and is also recommended for use with other fluorophores excited by yellow wavelengths. The bandpass emission filter functions to reduce or eliminate interference from fluorophores emitting in the deep red or near-infrared spectral regions. The Y-2E/C set is recommended when studying the following fluorophores: Texas Red, CY3.5, aminoactinomycin D (AAD), acid Fuchsin, Alexa Fluor 568 and 594, BOBO-3, BO-PRO-3, BODIPY, ROX (carboxy-X-rhodamine), DiBAC4(5), MitoTracker Red, mRFP-1 (monomeric red fluorescent protein), SYPRO Red, SYTO 17 (59,61,64), YO-PRO-3, and YOYO-3. The images presented in Figure 2 demonstrate the performance of this filter combination with a variety of yellow-absorbing fluorescence probes targeted at different intracellular locations.
Figure 2 - Nikon Y-2E/C Yellow Excitation Bandpass Filter Set
Figure 2(a) illustrates the fluorescence emission from a culture of HeLa cells that were immunofluorescently labeled with primary anti-histone (pan) mouse monoclonal antibodies followed by goat anti-mouse Fab fragments conjugated to Alexa Fluor 546. The absorption maximum of Alexa Fluor 546 is 556 nanometers and the emission maximum occurs at 573 nanometers (in the yellow region of the visible light spectrum). The primary antibody, produced from purified nuclear fractions of HeLa cells, binds specifically to an antigen determinant that is present on all five histone proteins (H1, H2A, H2B, H3, and H4). Note the strong orange-red fluorescence intensity from both the interphase nuclei and those in various stages of mitosis.
A culture of Indian Muntjac deerskin fibroblast cells stained with Alexa Fluor 568 conjugated to phalloidin, which binds to the intracellular filamentous actin network, is presented in Figure 2(b). The absorption maximum of Alexa Fluor 568 is 578 nanometers and the emission maximum occurs at 603 nanometers in the orange region of the visible light spectrum. In addition, the specimen was also simultaneously stained with DAPI (targeting DNA in the cell nucleus; blue emission) and MitoTracker Green FM (targeting mitochondria; green emission). Note the absence of signal from the green (MitoTracker) and blue (DAPI) fluorophores, which are not efficiently excited at yellow wavelengths, but the bright orange-red fluorescence exhibited by the actin filaments.
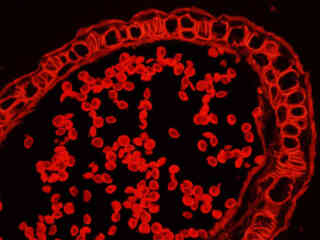
Fluorescence emission in a thin section of mouse intestine stained with Alexa Fluor 350 wheat germ agglutinin, a blue fluorescent lectin that is specific to the mucus of goblet cells is demonstrated in Figure 2(c). The specimen was simultaneously stained with Alexa Fluor 568 phalloidin (filamentous actin; 600 nanometer emission) and SYTOX Green (nuclei; 504 nanometer excitation and 523 nanometer emission). Note the significant amount of orange-red signal arising from Alexa Fluor 568 that has stained the actin network in the brush border.
Bovine pulmonary artery endothelial cells stained with MitoTracker Red CMXRos, which targets the intracellular mitochondrial network, are illustrated in Figure 2(d). The absorption maximum of MitoTracker Red CMXRos is 579 nanometers and the emission maximum occurs at 599 nanometers. In addition, the specimen was simultaneously stained with DAPI (targeting DNA in the cell nucleus; blue emission) and BODIPY FL-phallacidin (targeting actin; green emission). Note the absence of signal from the blue (DAPI) and green (BODIPY) fluorophores, but the bright orange-red fluorescence exhibited by the tubular mitochondria.
Illustrated in Figure 2(e) are rat kangaroo kidney (PtK2 line) epithelial cells that were immunofluorescently labeled with primary anti-keratin (an intermediate filament protein) mouse monoclonal antibodies followed by goat anti-mouse Fab fragments conjugated to the cyanine dye, Cy3. The absorption maximum of Cy3 is 552 nanometers and the emission maximum occurs at 570 nanometers. Keratins represent a class of water-insoluble proteins that form monofilaments, a category of intermediate filament that is present in the cytoskeletal structure. In addition, the specimen was simultaneously stained for nuclear DNA with DAPI. Note the absence of signal from the blue fluorophore (DAPI), which is not efficiently excited by yellow light, but the high level of orange-red fluorescence intensity from the Cy3-labeled keratin intermediate filament network.
Autofluorescence emission intensity from a Ginkgo tree (also known as the Maidenhair;Ginkgo biloba) staminate strobilus thin section is presented in Figure 2(f). Endogenous autofluorescence in plant tissues arises from a variety of biomolecules, including chlorophyll, carotene, and xanthophyll. In the yellow excitation region, chlorophyll has an absorption band with a low extinction coefficient, but still produces a detectable level of fluorescence at emission wavelengths of 600 nanometers and above (orange and red). For the Ginkgo tree tissue illustrated in Figure 2(f), note the presence of autofluorescence emission intensity in the orange and red spectral regions.
Additional Specimen Images with the Y-2E/C Filter Combination
HeLa Cell Histones
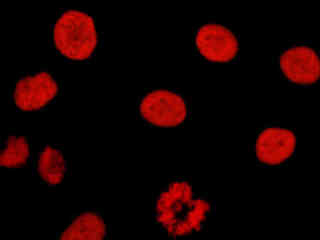
Fluorescence emission intensity from a culture of HeLa cells that were immunofluorescently labeled with primary anti-histone (pan) mouse monoclonal antibodies followed by goat anti-mouse Fab fragments conjugated to Alexa Fluor 546.
Indian Muntjac Cell Actin Cytoskeleton
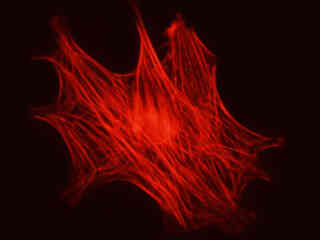
Fluorescence emission intensity from a culture of Indian Muntjac deerskin fibroblast cells stained with Alexa Fluor 568 conjugated to phalloidin, which binds to the intracellular filamentous actin network.
Mouse Intestine Thin Section
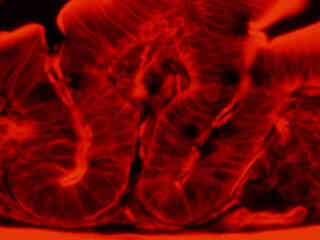
Fluorescence emission intensity from a thin section of mouse intestine stained with Alexa Fluor 350 wheat germ agglutinin, a blue fluorescent lectin that is specific to the mucus of goblet cells.
Bovine Pulmonary Artery Cell Mitochondria
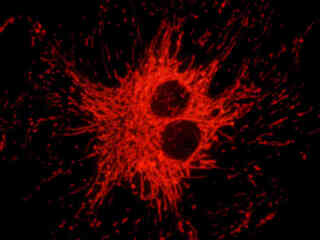
Fluorescence emission intensity from a culture of bovine pulmonary artery endothelial cells stained with MitoTracker Red CMXRos, which targets the intracellular mitochondrial network.
Rat Kangaroo Cell Intermediate Filaments
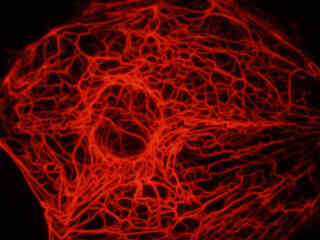
Fluorescence emission intensity from a culture of rat kangaroo kidney (PtK2 line) epithelial cells that were immunofluorescently labeled with primary anti-keratin (an intermediate filament protein) mouse monoclonal antibodies followed by goat anti-mouse Fab fragments conjugated to the cyanine dye, Cy3.
Ginkgo Staminate Strobilus Tissue
Autofluorescence emission intensity from a male Ginkgo tree (also known as the Maidenhair;Ginkgo biloba) staminate strobilus thin section.
HeLa Cells with Dil
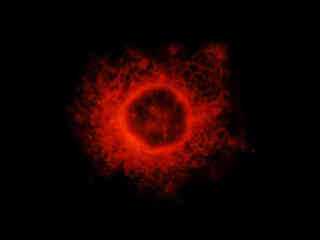
This section illustrates a culture of HeLa cells that were labeled with the lipophilic cell tracer carbocyanine dye, Dil, which targets membranes. The absorption maximum of Dil is 549 nanometers and the emission maximum occurs at 565 nanometers (in the yellow region of the visible light spectrum). Fluorescence intensity arising from labeled cytoskeletal membrane components is quite evident in the image even through the probe emission peak is 30 nanometers below the Y-2E/C filter set dichromatic mirror cut-on wavelength.
Contributing Authors
Related Nikon Products
Share this article:


