Yellow Excitation: Texas Red HYQ (Bandpass Emission)
Ultraviolet, visible, and near-infrared transmission spectral profiles for the Nikon Texas Red HYQ high-performance filter combination are illustrated below in Figure 1. This filter set is one of two in the Nikon yellow excitation group, both of which employ a bandpass emission (barrier) filter instead of a longpass variety, in order to limit interference from fluorophores emitting outside the wavelength region for which the combination is optimized. The 75-nanometer emission window (608 to 683 nanometers) is combined with a medium width (55 nanometers) excitation passband (532 to 587 nanometers) to allow selective excitation and detection of specific popular fluorophores, which are commonly used in multiple labeling experiments. The Texas Red HYQ filter combination is equipped with a 595-nanometer (cut-on wavelength) longpass dichromatic mirror.
Figure 1 - Texas Red HYQ (Wide Band Yellow Excitation)
Yellow Excitation Filter Block Texas Red HYQ Specifications
- Excitation Filter Wavelengths: 532-587 nanometers (bandpass, 560 CWL)
- Dichromatic Mirror Cut-on Wavelength: 595 nanometers (longpass, LP)
- Barrier Filter Wavelengths: 608-683 nanometers (bandpass, 645 CWL)
The Texas Red HYQ filter combination is designed to increase the brightness of secondary fluorescence without producing a corresponding increase in the signal-to-noise ratio. Steeper passbands are created by increasing the number of interference cavities in both the excitation and emission filters, allowing a closer proximity between the spectral profiles. The resulting wider and steeper filter passbands enable the set to provide more excitation energy and capture a higher level of fluorescence signal. This filter combination is optimized for use with the popular fluorescent probes Texas Red and Cy3.5, when they are used alone or in multiple labeling techniques, and is also recommended for applications with other fluorophores excited by yellow wavelengths. The bandpass emission filter functions to reduce or eliminate interference from fluorophores emitting in the deep red or near-infrared spectral regions. The Texas Red HYQ filter combination is designed as a higher-energy variation of the Nikon Y-2E/C set, with wider excitation and emission filter transmission regions. It is suitable for use with essentially the same group of probes, while offering improved performance for those emitting beyond the upper limits of the Y-2E/C emission band.
Because of increased energy transmission allowed by the expanded excitation and emission passband regions, images produced with the Texas Red HYQ set are typically brighter and appear redder than those from the similar Y-2E/C combination. The Texas Red HYQ filter set is recommended when studying the following fluorophores: Texas Red, CY3.5, aminoactinomycin D (AAD), acid Fuchsin, Alexa Fluor 568 and 594, Alizarin Complexon, BOBO-3, BO-PRO-3, BODIPY, ROX (carboxy-X-rhodamine), DiBAC4(5), HcRed, LDS 751 (bound to RNA), MitoTracker Red, mRFP-1 (monomeric red fluorescent protein), naphthofluorescein, SYPRO Red, SYTO 17 (59,61,64), YO-PRO-3, and YOYO-3. The images presented in Figure 2 demonstrate the performance of this filter combination with a variety of yellow-absorbing fluorescence probes targeted at different intracellular locations.
Figure 2 - Nikon Texas Red HYQ Yellow Excitation Bandpass Filter Set
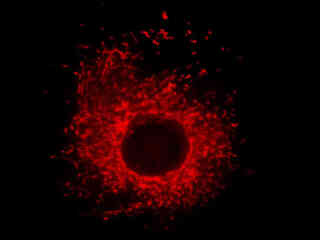
Presented in Figure 2(a) is the fluorescence emission from a culture of rat kangaroo kidney (PtK2 line) epithelial cells that were immunofluorescently labeled with primary anti-vimentin (an intermediate filament protein) mouse monoclonal antibodies followed by goat anti-mouse Fab fragments conjugated to rhodamine Red. The absorption maximum of rhodamine Red is 570 nanometers and the emission maximum occurs at 590 nanometers. Keratins represent a class of water-insoluble proteins that form monofilaments, a category of intermediate filament that is present in the cytoskeletal structure. In addition, the specimen was simultaneously stained for nuclear DNA with DAPI. Note the absence of signal from the blue fluorophore (DAPI), which is not efficiently excited by yellow light, but the high level of red fluorescence intensity from the rhodamine-labeled vimentin intermediate filament network.
Fluorescence emission intensity from a thin section of mouse kidney stained with multiple (3) fluorophores is displayed in Figure 2(b). Nuclei in the tissue section were targeted with the nucleic acid probe DAPI, which has an excitation maximum at 358 nanometers and an emission maximum at 461 nanometers when bound to DNA in cell cultures and tissue sections. In addition, the cryostat section was also simultaneously stained with Alexa Fluor 488 wheat germ agglutinin (glomeruli and convoluted tubules) and Alexa Fluor 568 phalloidin (filamentous actin and the brush border). Note the absence of signal from both the blue (DAPI) and green (Alexa Fluor 488) probes, but the intense red fluorescence due to the presence of Alexa Fluor 568 in the actin and brush border networks.
A culture of Indian Muntjac deerskin fibroblast cells stained with Alexa Fluor 568 conjugated to phalloidin, which binds to the intracellular filamentous actin network, is illustrated in Figure 2(c). The absorption maximum of Alexa Fluor 568 is 578 nanometers and the emission maximum occurs at 603 nanometers in the orange region of the visible light spectrum. In addition, the specimen was simultaneously stained with DAPI (targeting DNA in the cell nucleus; blue emission) and MitoTracker Green FM (targeting mitochondria; green emission). Note the absence of signal from the green (MitoTracker) and blue (DAPI) fluorophores, which are not efficiently excited at yellow wavelengths, but the bright orange-red fluorescence exhibited by the actin filaments.
Figure 2(d) demonstrates the fluorescence emission intensity from a culture of HeLa cells that were immunofluorescently labeled with primary anti-histone (pan) mouse monoclonal antibodies followed by goat anti-mouse Fab fragments conjugated to Alexa Fluor 546. The absorption maximum of Alexa Fluor 546 is 556 nanometers and the emission maximum occurs at 573 nanometers (in the yellow region of the visible light spectrum). The primary antibody, produced from purified nuclear fractions of HeLa cells, binds specifically to an antigen determinant that is present on all five histone proteins (H1, H2A, H2B, H3, and H4). Note the strong red fluorescence intensity from both the interphase nuclei and the single prophase nucleus.
Rat thoracic aorta (smooth muscle) cells stained with MitoTracker Red CMXRos, which targets the intracellular mitochondrial network, are illustrated in Figure 2(e). The absorption maximum of MitoTracker Red CMXRos is 579 nanometers and the emission maximum occurs at 599 nanometers. In addition, the specimen was simultaneously stained with DAPI (targeting DNA in the cell nucleus; blue emission) and BODIPY FL-phallacidin (targeting actin; green emission). Note the absence of signal from the blue (DAPI) and green (BODIPY) fluorophores, but the bright red fluorescence exhibited by the tubular mitochondria.
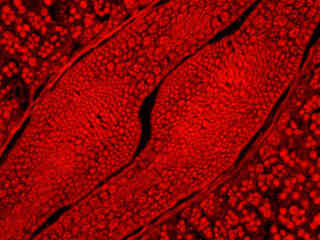
Autofluorescence emission intensity from a thin section of caster bean (Ricinus communis) tissue is demonstrated in Figure 2(f). Endogenous autofluorescence in plant tissues arises from a variety of biomolecules, including chlorophyll, carotene, and xanthophyll. In the yellow excitation region, chlorophyll has an absorption band with a low extinction coefficient, but still produces a detectable level of fluorescence at emission wavelengths of 580 nanometers and above (orange and red). For the caster bean thin section illustrated above, note the presence of autofluorescence emission intensity in the red spectral regions, but the absence of intensity at lower (green and blue) wavelengths.
Additional Specimen Images with the Texas Red HYQ Filter Combination
Rat Kangaroo Cell Intermediate Filaments
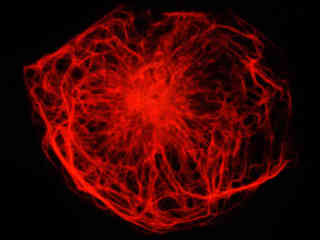
Fluorescence emission intensity from a culture of rat kangaroo kidney (PtK2 line) epithelial cells that were immunofluorescently labeled with primary anti-vimentin (an intermediate filament protein) mouse monoclonal antibodies followed by goat anti-mouse Fab fragments conjugated to rhodamine Red.
Mouse Kidney Tissue
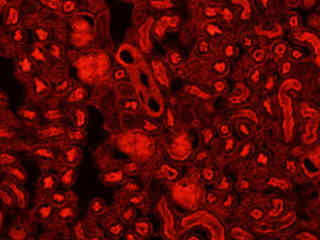
Fluorescence emission intensity from a thin section of mouse kidney stained with multiple (3) fluorophores.
Indian Muntjac Cell Actin Cytoskeleton
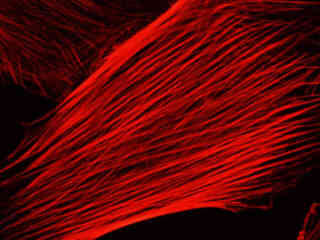
Fluorescence emission intensity from a culture of Indian Muntjac deerskin fibroblast cells stained with Alexa Fluor 568 conjugated to phalloidin, which binds to the intracellular filamentous actin network.
HeLa Cell Histones
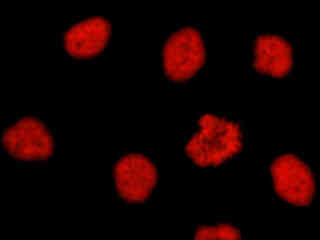
Fluorescence emission intensity from a culture of HeLa cells that were immunofluorescently labeled with primary anti-histone (pan) mouse monoclonal antibodies followed by goat anti-mouse Fab fragments conjugated to Alexa Fluor 546.
Contributing Authors
Related Nikon Products
Share this article:


