Green Excitation: TRITC HYQ (Bandpass Emission)
The Nikon TRITC HYQ green excitation filter combination is optimized for use with the popular fluorophore TRITC (tetramethylrhodamine isothiocyanate) and employs sharp cut-on and cut-off transitions, which are characteristic of filter sets having the HYQ designation. This filter combination is designed to minimize signal crossover (spectral bleed-through) and produce images with less noise and darker backgrounds than standard filter sets. Ultraviolet, visible, and near-infrared transmission spectral profiles for the TRITC HYQ filter set are illustrated below in Figure 1. The combination of a medium width excitation band in the green spectral region with a bandpass barrier filter allows detection of orange to red fluorescence, while eliminating red wavelengths beyond 650 nanometers.
Figure 1 - TRITC HYQ (Medium Band Green Excitation)
Green Excitation Filter Block TRITC HYQ Specifications
- Excitation Filter Wavelengths: 530-560 nanometers (bandpass, 545 CWL)
- Dichromatic Mirror Cut-on Wavelength: 570 nanometers (longpass, LP)
- Barrier Filter Wavelengths: 590-650 nanometers (bandpass, 620 CWL
The TRITC HYQ filter set has a similar configuration to the Cy3 HYQ fluorescence filter combination, but with a red-shifted and narrower emission passband. The dichromatic mirror cut-on wavelength is 570 nanometers, and is combined with a medium 30-nanometer excitation passband (530 to 560 nanometers) along with the 60-nanometer emission passband (590 to 650 nanometers). The set enables selective excitation and detection of specific popular fluorophores used in multiple labeling experiments, and is generally applicable to a wide range of probes excited by green or yellow wavelengths. The TRITC HYQ bandpass emission filter is the same as that utilized in the G-2E/C green excitation combination, while a broadened excitation energy window and red-shifted dichromatic mirror cut-on contribute to higher signal level for TRITC and DiI, as well as improved performance for DsRed (a fluorescent protein) and spectrally similar synthetic fluorochromes. In addition, the filter combination is useful for imaging specimens labeled with the far-red fluorescing HcRed protein.
Although the TRITC HYQ filter combination incorporates specific components that are used individually in other filter sets from the green-excitation category, they are combined in a unique configuration that is suitable for detection of tetramethylrhodamine isothiocyanate (TRITC) and the cyanine dye, DiI. The TRITC HYQ combination is the recommended set for investigations with DsRed I and II and HcRed fluorescent proteins. In addition, this filter set can be utilized with essentially the same broad range of green-excited fluorochromes as theCy3 HYQ and G-2E/C combinations. The TRITC HYQ set is recommended when studying the following fluorophores: DsRed fluorescent protein (DsRedFP), HcRed fluorescent protein (HcRedFP), TRITC, Acridine Red, Alexa Fluor 546 and 555, Alizarin Red, BODIPY probes, Calcium Orange, CellTracker Orange, DiI, DiIC16, DiIC18, FluoroRuby, LysoTracker Yellow (HCK-123), Magnesium Orange, Merocyanine 540, MitoTracker Orange, NeuroTrace 530/615, propidium iodide, Pyronin B, RedoxSensor Red CC-1, rhodamine derivatives, Sevron Brilliant Red (B and 2B), SYTO (82, 83, 84, and 85), and SYTOX Orange. The images presented in Figure 2 demonstrate the performance of this filter combination with a variety of green-absorbing fluorescence probes targeted at different intracellular locations.
Figure 2 - Nikon TRITC HYQ Green Excitation Bandpass Filter Set
Illustrated in Figure 2(a) is the fluorescence emission observed in a culture of canine kidney epithelial (Madin-Darby; MDCK line) cells stained with phalloidin conjugated to Alexa Fluor 568, which targets the intracellular cytoskeletal F-actin network. The visible light absorption maximum of Alexa Fluor 568 is 578 nanometers and the emission maximum occurs at 603 nanometers. Note the bright fluorescence signal exhibited by the filamentous actin network, which extends throughout the cytoplasm. In addition to phalloidin, the specimen was also labeled with wheat germ agglutinin conjugated to Oregon Green 488 (targeting the Golgi network; blue excitation and green emission) and DAPI (staining DNA in the nucleus; ultraviolet excitation and blue emission). Neither of these fluorophores are imaged with the Nikon TRITC HYQ filter combination.
A culture of rat kangaroo kidney epithelial cells (PtK2 line) that were immunofluorescently labeled with primary anti-tubulin (bovine) mouse monoclonal antibodies followed by goat anti-mouse Fab fragments conjugated to tetramethylrhodamine (TMR), is presented in Figure 2(b). The visible light absorption maximum of TMR is 550 nanometers and the emission maximum occurs at 573 nanometers. In addition, the specimen was stained with DAPI (targeting DNA in the nucleus; ultraviolet excitation and blue emission), but this fluorophore is not imaged with the Nikon TRITC HYQ filter combination. Note the bright fluorescence intensity exhibited by the microtubule network, which extends throughout the cytoplasm in these epithelial cells.
Fluorescence emission intensity from a culture of normal African green monkey kidney epithelial cells (CV-1 line) stained with MitoTracker Red CMXRos, which targets the intracellular mitochondrial network, is demonstrated in Figure 2(c). The visible light absorption maximum of MitoTracker Red CMXRos is 579 nanometers and the emission maximum occurs at 599 nanometers. In addition, the specimen was labeled with Alexa Fluor 488 conjugated to phalloidin (binding to F-actin; green emission) and DAPI (staining DNA in the nucleus; blue emission). Note the bright fluorescence intensity exhibited by the tubular mitochondrial network, but the absence of signal from the blue and green fluorophores.
Figure 2(d) illustrates a culture of albino Swiss mouse embryo cells (3T3 line) that were immunofluorescently labeled with primary anti-vinculin mouse monoclonal antibodies followed by goat anti-mouse Fab fragments conjugated to Cy3. The visible light absorption maximum of Cy3 is 552 nanometers and the emission maximum occurs at 570 nanometers. Note the prominent staining of the cellular attachment network in the central portion and periphery of these cells. In addition, the specimen was simultaneously stained for DNA with the ultraviolet-absorbing probe DAPI, and for the cytoskeletal filamentous actin network with Alexa Fluor 488 conjugated to phalloidin.
Human osteosarcoma cells (U-2 line) that were labeled with Alexa Fluor 350 conjugated to wheat germ agglutinin for the Golgi apparatus, Alexa Fluor 488 conjugated to phalloidin for cytoskeletal actin, and propidium iodide for the nuclei, are presented in Figure 2(e). The visible light absorption maximum of propidium iodide, a phenanthridine specific for double stranded DNA and RNA, is 536 nanometers and the emission maximum occurs at 617 nanometers. Note the lack of fluorescence signal from the blue and green fluorophores with the Nikon TRITC HYQ filter combination.
Autofluorescence emission from a horsetail fern (Equisetum arvense) mature strobilus thin section is demonstrated in Figure 2(f). Endogenous autofluorescence in plant tissues arises from a variety of biomolecules, including chlorophyll, carotene, and xanthophyll. In the green excitation region, chlorophyll has an absorption band with a low extinction coefficient, but still produces a detectable level of fluorescence at emission wavelengths of 550 nanometers and above (green, yellow, orange, and red). For the fern reproductive tissue illustrated above, note the presence of autofluorescence emission intensity in the orange and red spectral regions, which is strongly reminiscent of a darkfield image.
Additional Specimen Images with the TRITC HYQ Filter Combination
Canine Kidney Epithelial Cell F-Actin Network
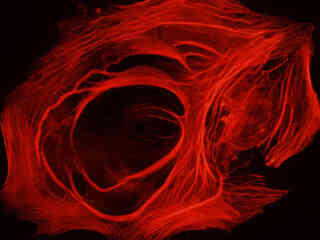
Fluorescence emission intensity from a culture of canine kidney epithelial cells (Madin-Darby; MDCK line) stained with phalloidin conjugated to Alexa Fluor 568, which targets the intracellular cytoskeletal F-actin network.
Rat Kangaroo Microtubule Network
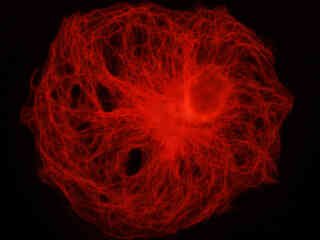
Fluorescence emission intensity from a culture of rat kangaroo kidney epithelial cells (PtK2line) that were immunofluorescently labeled with primary anti-tubulin (bovine) mouse monoclonal antibodies followed by goat anti-mouse Fab fragments conjugated to tetramethylrhodamine (TMR).
African Green Monkey Kidney Epithelial Cell Mitochondria
Fluorescence emission intensity from a culture of normal African green monkey kidney epithelial cells (CV-1 line) stained with MitoTracker Red CMXRos, which targets the intracellular mitochondrial network.
Albino Swiss Mouse Cell Vinculin
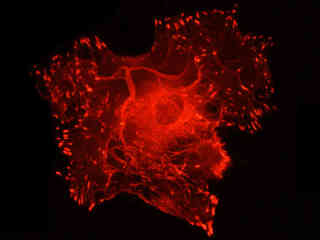
Fluorescence emission intensity from a culture of albino Swiss mouse embryo cells (3T3line) that were immunofluorescently labeled with primary anti-vinculin mouse monoclonal antibodies followed by goat anti-mouse Fab fragments conjugated to Cy3.
Human Osteosarcoma Cell Nuclei
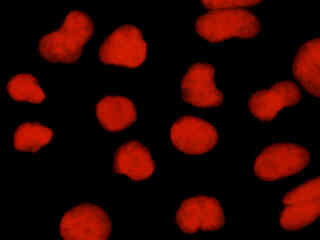
Fluorescence emission intensity from a culture of human osteosarcoma cells (U-2 line) that were labeled with Alexa Fluor 350 conjugated to wheat germ agglutinin for the Golgi apparatus, Alexa Fluor 488 conjugated to phalloidin for cytoskeletal actin, and propidium iodide for the nuclei.
Horsetail Fern Mature Strobilus Autofluorescence
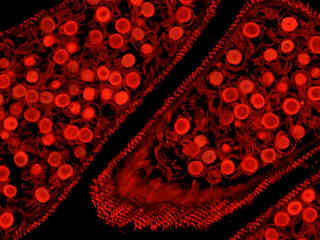
Autofluorescence emission intensity from a horsetail fern (Equisetum arvense) mature strobilus thin section. Endogenous autofluorescence in plant tissues arises from a variety of biomolecules, including chlorophyll, carotene, and xanthophyll.
Rat Kangaroo Cellular Cytokeratin Intermediate Filament Network with Cy3
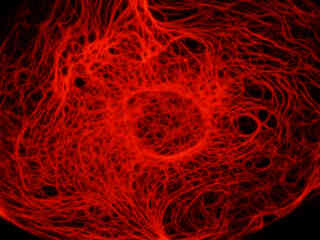
Observe the fluorescence emission intensity from a culture of rat kangaroo kidney epithelial cells (PtK2 line) that were immunofluorescently labeled with primary anti-cytokeratin (pan) mouse monoclonal antibodies followed by goat anti-mouse Fab fragments conjugated to Cy3. In addition, the specimen was stained with DAPI (targeting DNA in the nucleus; ultraviolet excitation and blue emission), but this fluorophore is not imaged with the Nikon TRITC HYQ filter combination. Note the bright fluorescence intensity exhibited by the cytokeratin intermediate filament network in these epithelial cells.
Pine Needle Leaf Autofluorescence
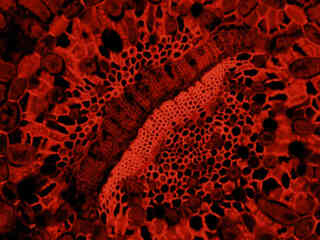
Examine the autofluorescence emission intensity from a pine (Pinus strobus) needle leaf. For the pine tissue illustrated in this section, note the presence of significant levels of autofluorescence emission intensity in the orange and red spectral regions, which is strongly reminiscent of a darkfield image.
Rat Kangaroo Cellular Vimentin Intermediate Filament Network with Rhodamine Red
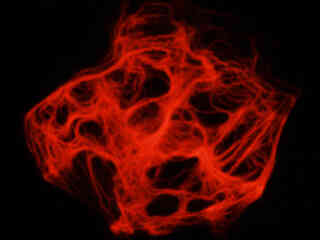
A culture of rat kangaroo kidney epithelial cells (PtK2 line) was immunofluorescently labeled with primary anti-vimentin mouse monoclonal antibodies followed by goat anti-mouse Fab fragments conjugated to Rhodamine Red. The visible light absorption maximum of Rhodamine Red is 570 nanometers and the emission maximum occurs at 590 nanometers. In addition, the specimen was stained with DAPI (targeting DNA in the nucleus).
African Green Monkey Kidney Cells with Propidium Iodide
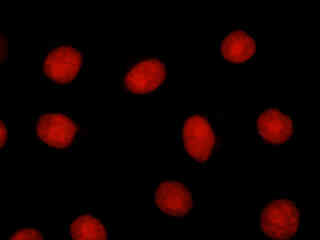
Observe the fluorescence emission from a culture of transformed African green monkey kidney cells (COS-7 line) that were labeled with Alexa Fluor 350 conjugated to wheat germ agglutinin for the Golgi apparatus, Alexa Fluor 488 conjugated to phalloidin for cytoskeletal actin, and propidium iodide for the nuclei. Note the lack of fluorescence signal from the blue and green fluorophores with the Nikon TRITC HYQ filter combination.
Contributing Authors
Related Nikon Products
Share this article:


