Blue-Violet Excitation: CFP (Bandpass Emission)
The high-performance Nikon CFP (cyan fluorescent protein) filter combination differs from the other three complements in the blue-violet group by employing a bandpass emission filter, whose 40-nanometer passband (460-500 nanometers) restricts detection to fluorochromes emitting in the cyan-blue spectral region. Ultraviolet, visible, and near-infrared transmission spectral profiles for this filter set are illustrated below in Figure 1. A narrow 20-nanometer excitation passband minimizes autofluorescence and is intended to avoid excitation of certain fluorochromes commonly utilized for dual labeling experiments in conjunction with cyan fluorescent protein. Although primarily designed for imaging of fluorescent proteins, this bandpass emission combination is useful for obtaining images of specimens having multiple labels when one of the fluorophores is efficiently excited in the blue-violet spectral region.
Figure 1 - Cyan Fluorescent Protein (Blue-Violet Excitation)
Blue-Violet Excitation Filter Block CFP Specifications
- Excitation Filter Wavelengths: 426-446 nanometers (bandpass, 436 CWL)
- Dichromatic Mirror Cut-on Wavelength: 455 nanometers (longpass, LP)
- Barrier Filter Wavelengths: 460-500 nanometers (bandpass, 480 CWL)
The CFP fluorescence filter set is designed for optimum performance with cyan fluorescent protein excited by blue-violet wavelengths, in particular when utilized for dual labeling techniques in combination with enhanced yellow fluorescent protein. Although originally designed to detect emission from the protein fluorophore, this filter combination is essentially a bandpass emission blue-violet excitation set and can be utilized to examine a wide spectrum of specimens that absorb light in this spectral region.
The excitation bandpass of the CFP combination does not generally excite yellow fluorescent protein (excited at 513 nanometers), and by employing a bandpass emission filter, yellow fluorescence is excluded from detection when the CFP filter set is used. It should be noted that some signal from enhanced green fluorescent protein may be detected with this filter set, and therefore that fluorochrome is not a good candidate for dual labeling with the cyan protein variant. The CFP filter combination is recommended when studying the following fluorophores: ACMA, acridine homodimer, Astrazon Yellow, Atabrine, catecholamine, CFP, Chromomycin A, Genacryl Brilliant Yellow, Genacryl Yellow, Sevron Yellow, SYTO 42 (and 43, 44, 45), and SYTOX Blue. The images presented in Figure 2 demonstrate the performance of this filter combination with a variety of blue-violet-absorbing fluorescence probes targeted at different intracellular locations.
Figure 2 - Nikon CFP Blue-Violet Excitation Bandpass Filter Set
Presented in Figure 2(a) is the fluorescence emission intensity from a culture of rat thoracic aorta (muscle) cells that were immunofluorescently labeled with primary anti-oxphos complex V inhibitor protein monoclonal antibodies (mouse) followed by goat anti-mouse Fab fragments conjugated to Pacific Blue. The absorption maximum of Pacific Blue is 410 nanometers and the emission maximum occurs at 455 nanometers. In addition, the specimen was simultaneously stained for F-actin with Alexa Fluor 488 (green) conjugated to phalloidin, and for DNA with SYTOX Orange. Note the absence of signal from both the orange and green fluorophores (SYTOX localized in the nucleus would appear green under these observation conditions). In many cases, SYTOX Orange stains a variety of cytoplasmic elements in addition to DNA, although this is not evident in the image.
Figure 2(b) demonstrates fluorescence emission from a culture of rat skeletal muscle tissue cells (L6 cell line; myoblasts) that were immunofluorescently labeled with primary anti-bovine alpha-tubulin mouse monoclonal antibodies followed by goat anti-mouse Fab fragments conjugated to Alexa Fluor 430. The absorption maximum of Alexa Fluor 430 is 431 nanometers and the emission maximum occurs at 541 nanometers. Although the intracellular microtubule network is heavily stained using this protocol, the bandpass filter in the CFP combination does not pass a large amount of fluorescence emission from Alexa Fluor 430, and produces only a weak signal that is concentrated near the nucleus. In addition, the specimen was simultaneously stained for F-actin with Alexa Fluor 488 conjugated to phalloidin, and for mitochondria with MitoTracker Red CMXRos. Note the absence of signal from the red (MitoTracker) and green (Alexa Fluor 488) fluorophores.
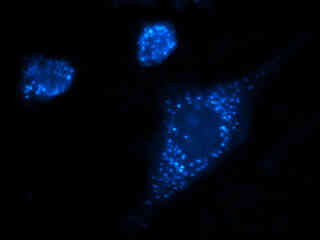
Fluorescence emission intensity from a culture of bovine pulmonary artery endothelial cells stained with DAPI, which targets DNA in the cell nucleus, is presented in Figure 2(c). The absorption maximum of DAPI (4',6-diamidino-2-phenylindole) is 358 nanometers and the emission maximum occurs at 461 nanometers when the fluorochrome is bound to DNA. In addition, the specimen was simultaneously stained with BODIPY FL phallacidin (targeting actin; green emission) and MitoTracker Red CMXRos (targeting mitochondria; red emission). Note the absence of signal from the red (MitoTracker) fluorophore, but bleed-through from the green (BODIPY FL) probe, which appears as a weak cyan signal surrounding the nuclei. In addition, the nuclei appear less intense and with fluorescence emission shifted to longer wavelengths than comparable images with the Nikon violet and ultraviolet filter combinations.
Nuclei in a mouse kidney thin tissue section (Figure 2(d)) were targeted with the nucleic acid probe DAPI, which has an excitation maximum at 358 nanometers and an emission maximum at 461 nanometers when bound to DNA in cell cultures and tissue sections. In addition, the cryostat section in Figure 2(d) was also simultaneously stained with Alexa Fluor 488 wheat germ agglutinin (glomeruli and convoluted tubules) and Alexa Fluor 568 phalloidin (filamentous actin and the brush border). Note the absence of signal from the red (Alexa Fluor 568) fluorophore, but the significant amount of bleed-through into the cyan emission filter from the green (Alexa Fluor 488) probe. With an ultraviolet excitation bandpass emission filter set, the darker nuclei in the specimen would appear bright blue and the signal from Alexa Fluor 488 would be largely absent.
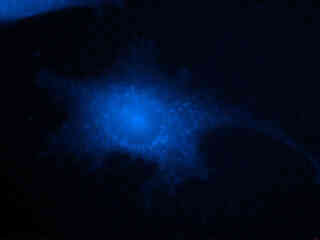
Figure 2(e) illustrates the emission intensity from a culture of rat kangaroo kidney epithelial cells (PtK2 line) that were immunofluorescently labeled with primary anti-cytokeratin (an intermediate filament protein) mouse monoclonal antibodies followed by goat anti-mouse Fab fragments conjugated to Marina Blue. The absorption maximum of Marina Blue is 365 nanometers and the emission maximum occurs at 460 nanometers. In addition, the specimen was simultaneously stained for mitochondria with MitoTracker Red CMXRos. Note the absence of signal from the red fluorophore with this bandpass emission filter combination. It should also be mentioned that the lack of significant absorption for Marina Blue in the blue-violet region results in a comparatively weak signal with the CFP filter set.
Autofluorescence emission intensity from a thin section of fern strobilus (Cyrtomium falcatum) tissue is demonstrated in Figure 2(f). Endogenous autofluorescence in plant tissues arises from a variety of biomolecules, including lignins, chlorophyll, carotene, and xanthophyll. In the blue-violet region, chlorophyll has an absorption band with a high extinction coefficient and produces a significant amount of fluorescence when excited with wavelengths between 400 and 440 nanometers. Note the absence of spectral bleed-through from autofluorescence emission in the green and red spectral regions with the CFP filter combination.
Additional Specimen Images with the CFP Filter Combination
Rat Thoracic Aorta Cellular Mitochondria

Fluorescence emission intensity from a culture of rat thoracic aorta (muscle) cells that were immunofluorescently labeled with primary anti-oxphos complex V inhibitor protein monoclonal antibodies (mouse) followed by goat anti-mouse Fab fragments conjugated to Pacific Blue.
Rat Skeletal Muscle Tubulin
Fluorescence emission intensity from a culture of rat skeletal muscle tissue cells (L6 cell line; myoblasts) that were immunofluorescently labeled with primary anti-bovine alpha-tubulin mouse monoclonal antibodies followed by goat anti-mouse Fab fragments conjugated to Alexa Fluor 430.
Bovine Pulmonary Artery Cell Nuclei
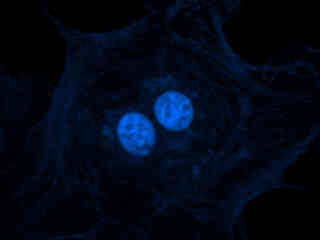
Fluorescence emission intensity from a culture of bovine pulmonary artery endothelial cells stained with DAPI, which targets DNA in the cell nucleus.
Mouse Kidney Tissue
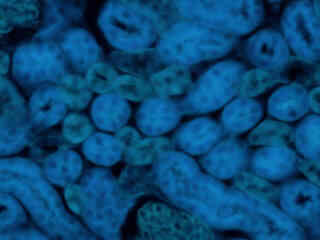
Fluorescence emission intensity from a thin section of mouse kidney stained with multiple (3) fluorophores.
Rat Kangaroo Cell Intermediate Filaments

Fluorescence emission intensity from a culture of rat kangaroo kidney epithelial cells (PtK2 line) that were immunofluorescently labeled with primary anti-cytokeratin (an intermediate filament protein) mouse monoclonal antibodies followed by goat anti-mouse Fab fragments conjugated to Marina Blue.
Fern Strobilus Thin Section
Autofluorescence emission intensity from a thin section of fern strobilus (Cyrtomium falcatum) tissue. Endogenous autofluorescence in plant tissues arises from a variety of biomolecules, including lignins, chlorophyll, carotene, and xanthophyll.
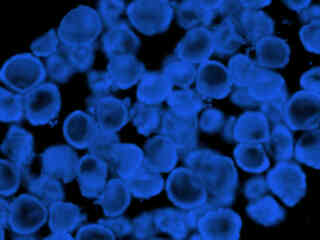
Rat Skeletal Muscle CDC6
A culture of rat skeletal muscle tissue cells (L6 cell line; myoblasts) were immunofluorescently labeled with primary anti-cdc6 (human) mouse monoclonal antibodies followed by goat anti-mouse Fabfragments conjugated to Marina Blue. Cdc6 is expressed in actively replicating cells to function during eukaryotic replication initiation, and is essential for DNA synthesis.
Contributing Authors
Related Nikon Products
Share this article:


