Red Excitation: Cy5 HYQ (Bandpass Emission)
Ultraviolet, visible, and near-infrared transmission spectral profiles for components of the high-performance Nikon Cy5 HYQ filter combination are illustrated below in Figure 1. Each individual component in this filter set is specifically designed to optimize detection of fluorescence from the fluorochrome Cy5 (along with spectrally similar probes), and the set also provides excellent performance for the majority of fluorophores excited by red wavelengths. The filter combination utilizes wide passband excitation and emission filters to provide maximum signal level, as is characteristic of the Nikon HYQ filter combination group.
Figure 1 - Cy5 HYQ (Orange-Red Wide Band Excitation)
The Cy5 HYQ set employs a bandpass emission (barrier) filter (pass band region between 663 and 738 nanometers) instead of a longpass variety, in order to limit interference from fluorophores emitting outside the intended wavelength region, and to reduce autofluorescence. The 75-nanometer emission window is combined with a wide 60-nanometer excitation passband (590 to 650 nanometers) to allow selective excitation and detection of specific popular fluorophores, which have absorption peaks in the orange to red spectral region. A longpass dichromatic mirror (660-nanometer cut-on wavelength) is provided in the Cy5 HYQ filter combination.
Red Excitation Filter Block Cy5 HYQ Specifications
- Excitation Filter Wavelengths: 590-650 nanometers (bandpass, 620 CWL)
- Dichromatic Mirror Cut-on Wavelength: 660 nanometers (longpass, LP)
- Barrier Filter Wavelengths: 663-738 nanometers (bandpass, 700 CWL)
The Cy5 HYQ filter combination is designed with steep passband transitions, allowing the benefits of wide bandpass regions while maintaining sufficient signal separation to avoid an increased noise level relative to the detected emission. Such sharp filter transitions are created by increasing the number of interference cavities in both the excitation and emission filters, enabling a closer spectral proximity between the two bandpass regions. The resulting wider and steeper filter passbands allow the set to provide more excitation energy and capture a higher level of fluorescence signal. Because the range of fluorescence wavelengths transmitted by the Cy5 HYQ combination extends into the near-infrared spectral region, which is either invisible or only faintly visible to the human eye, detectors with near-infrared sensitivity must be used to maximize the captured fluorophore emission.
This filter combination is optimized for use with popular fluorescent probes such as Cy5, Alexa Fluor 647, and allophycocyanin (APC), when the dyes are used alone or in multiple labeling techniques, and is also recommended for applications with other fluorophores excited by orange to red wavelengths. The bandpass emission filter functions to reduce or eliminate interference from emission in the infrared spectral region beyond approximately 740 nanometers. The Cy5 HYQ filter set is recommended when studying the following fluorophores: Alexa Fluor 633 and 647, APC, BODIPY 650/665, Cy5, Cy5.1.8, DiD (indodicarbocyanine), DiIC1(5), DiSC3(5), MitoTracker Deep Red 633, NeuroTrace 640/660, Nile Blue, SYTO (derivatives 60, 62, and 63), TO-PRO-3, and TOTO-3. The images presented in Figure 2 demonstrate the performance of this filter combination with a variety of orange and red-absorbing fluorescence probes targeted at different intracellular locations.
Figure 2 - Nikon Cy5 HYQ Red Excitation Filter Set
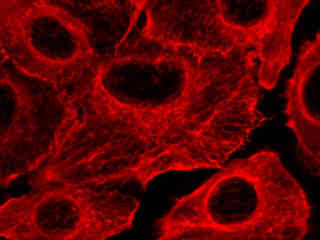
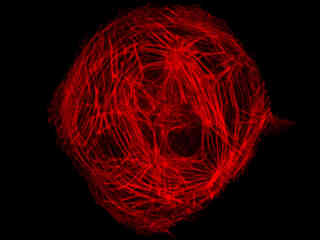
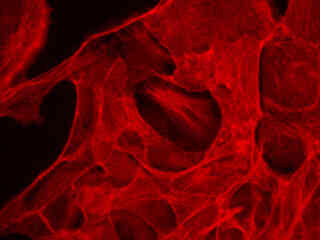
Presented in Figure 2(a) is the fluorescence emission profile from a culture of Indian Muntjac deerskin fibroblast cells that were immunofluorescently labeled with primary anti-bovine alpha-tubulin mouse monoclonal antibodies followed by goat anti-mouse Fab fragments conjugated to Cy5. The visible light absorption maximum of Cy5 is 649 nanometers and the emission maximum occurs at 670 nanometers. All of the images in Figure 2 were captured in 12-bit grayscale mode, but subsequently pseudocolored by converting to the RGB color palette and setting the green and blue channels to zero (to produce a red image). Note the bright fluorescence intensity exhibited by the microtubule network in Figure 2(a).
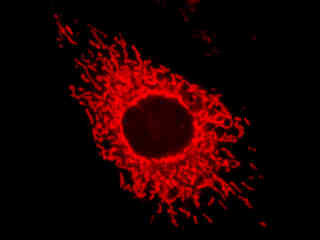
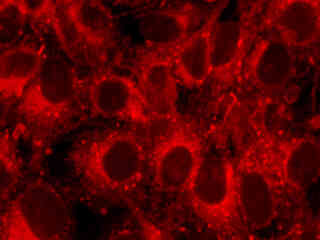
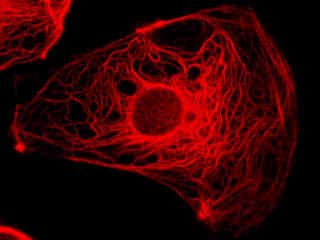
A culture of male pig kidney epithelial cells (Sus scrofa; LLC-PK1 line) stained with MitoTracker Deep Red 633 is presented in Figure 2(b). The visible light absorption maximum of MitoTracker Deep Red 633 is 644 nanometers and the emission maximum occurs at 665 nanometers. Fluorescence emission intensity exhibited by the tubular mitochondrial network extends throughout the cytoplasm of the central cell in the image.
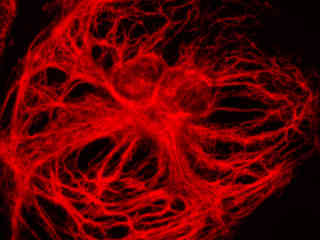
Fluorescence emission in a culture of rat kangaroo (PtK2 line) epithelial kidney cells that were immunofluorescently labeled with primary anti-vimentin mouse monoclonal antibodies followed by goat anti-mouse F(ab')2 fragments conjugated to biotin is demonstrated in Figure 2(c). The biotin secondary antibody was subsequently absorbed with a streptavidin conjugate of QDot 655. The visible light absorption extinction coefficient of QDot 655 occurs over a wide range that increases with decreasing wavelength. However, unlike the case with organic chromophores, fluorescence emission features a symmetrical profile in quantum dots (centered at 655 nanometers for this species).
Swiss albino mouse embryo cells (3T3 line) stained with the carbocyanine dye DiD, which targets lipophilic organelles, including the plasma membrane, are presented in Figure 2(d). The visible light absorption maximum of DiD is 644 nanometers and the emission maximum occurs at 665 nanometers. Carbocyanine probes are often utilized in apoptosis experiments and as tracers for cellular migration.
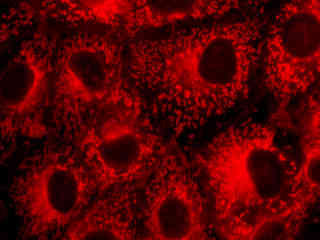
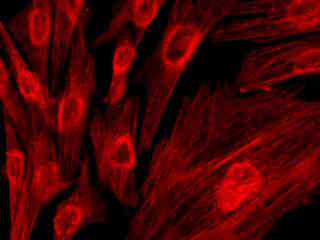
Figure 2(e) illustrates fluorescence emission in a culture of HeLa cells that were immunofluorescently labeled with primary anti-histone (pan) mouse monoclonal antibodies followed by goat anti-mouse Fab fragments conjugated to Alexa Fluor 647. The visible light absorption maximum of Alexa Fluor 647 is 649 nanometers and the emission maximum occurs at 666 nanometers (in the deep red region of the visible light spectrum). The primary antibody, produced from purified nuclear fractions of HeLa cells, binds specifically to an antigen determinant that is present on all five histone proteins (H1, H2A, H2B, H3, and H4).
Autofluorescence emission intensity from starch grains and other components in a thin section of potato (Solanum tuberosum) tuber tissue is demonstrated in Figure 2(f). Endogenous autofluorescence in plant tissues arises from a variety of biomolecules, including chlorophyll, carotene, and xanthophyll. In the red absorption region, chlorophyll has an absorption band with a low extinction coefficient, but still produces a detectable level of fluorescence at emission wavelengths of 650 nanometers and above (deep red region). For the starch grains illustrated above, note the presence of autofluorescence emission intensity in the red spectral region.
Additional Specimen Images with the Cy5 HYQ Filter Combination
Indian Muntjac Microtubule Network
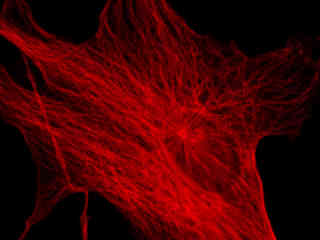
Fluorescence emission intensity from a culture of Indian Muntjac deerskin fibroblast cells that were immunofluorescently labeled with primary anti-bovine alpha-tubulin mouse monoclonal antibodies followed by goat anti-mouse Fab fragments conjugated to Cy5.
Pig Kidney Epithelial Cell Mitochondria
Fluorescence emission intensity from a culture of male pig kidney epithelial cells (Sus scrofa; LLC-PK1 line) stained with MitoTracker Deep Red 633, which targets the intracellular mitochondrial network.
Rat Kangaroo Kidney Cell Vimentin
Fluorescence emission intensity from a culture of rat kangaroo (PtK2 line) epithelial kidney cells that were immunofluorescently labeled with primary anti-vimentin mouse monoclonal antibodies followed by goat anti-mouse F(ab')2 fragments conjugated to biotin.
Swiss Mouse Embryo Cells Stained with DiD
Fluorescence emission intensity from a culture of albino Swiss mouse embryo cells (3T3line) stained with the carbocyanine dye DiD, which targets lipophilic organelles, including the plasma membrane.
HeLa Cell Histones
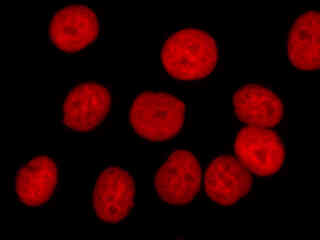
Fluorescence emission intensity from a culture of HeLa cells that were immunofluorescently labeled with primary anti-histone (pan) mouse monoclonal antibodies followed by goat anti-mouse Fab fragments conjugated to Alexa Fluor 647.
Potato Tissue Section
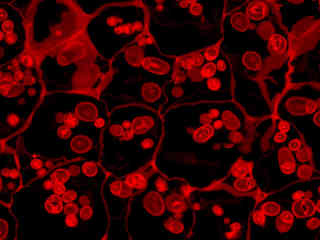
Autofluorescence emission intensity from starch grains and other components in a thin section of potato (Solanum tuberosum) tuber tissue. Endogenous autofluorescence in plant tissues arises from a variety of biomolecules, including chlorophyll, carotene, and xanthophyll.
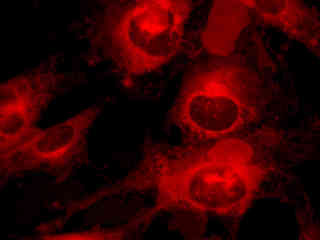
Bovine Pulmonary Artery Endothelial (BPAE) Cells with MitoTracker Deep Red 633
Examine a culture of bovine pulmonary artery endothelial cells stained with MitoTracker Deep Red 633, which targets the intracellular mitochondrial network. The visible light absorption maximum of MitoTracker Deep Red 633 is 644 nanometers and the emission maximum occurs at 665 nanometers.
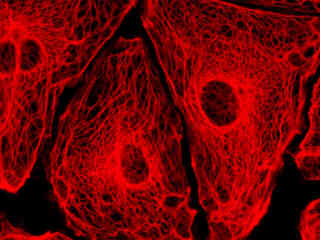
Pig Kidney Cytokeratin Intermediate Filaments with Cy5
A culture of male pig kidney cells (Sus scrofa; LLC-PK1 line) was immunofluorescently labeled with primary anti-cytokeratin (pan) mouse monoclonal antibodies followed by goat anti-mouse Fab fragments conjugated to Cy5. Note the bright fluorescence intensity exhibited by the intermediate filament network, which extends throughout the cytoplasm in these epithelial cells.
Canine Kidney Epithelial Cells with DiD
Observe the fluorescence emission intensity from a culture of canine kidney epithelial (Madin-Darby; MDCK line) cells stained with the carbocyanine dye DiD, which targets lipophilic organelles, including the plasma membrane. Carbocyanine probes are often utilized in apoptosis experiments and as tracers for cellular migration.
Swiss Mouse Embryo Cell Golgi Apparatus with Cy5
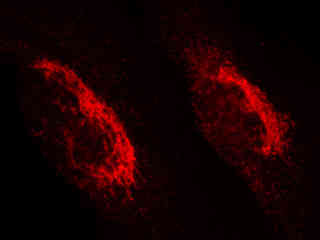
The cells (3T3 line) were immunofluorescently labeled with primary anti-human golgin-97 mouse monoclonal antibodies followed by goat anti-mouse Fab fragments conjugated to Cy5. Anti-human golgin-97 antibodies recognize a 97-kiloDalton protein termed golgin-97, which is a member of the granin protein family and a peripheral membrane protein localized on the cytoplasmic face of the Golgi apparatus.
Bovine Pulmonary Artery Cytoskeletal F-Actin Network with Alexa Fluor 633
A culture of bovine pulmonary artery endothelial cells was stained with phalloidin conjugated to Alexa Fluor 633, which targets the intracellular cytoskeletal F-actin network. The visible light absorption maximum of Alexa Fluor 633 is 621 nanometers and the emission maximum occurs at 639 nanometers.
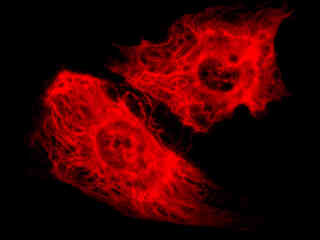
Indian Muntjac Cytokeratin Intermediate Filaments with Alexa Fluor 647
Observe the fluorescence emission intensity from a culture of Indian Muntjac deerskin fibroblast cells that were immunofluorescently labeled with primary anti-cytokeratin (pan) mouse monoclonal antibodies followed by goat anti-mouse Fab fragments conjugated to Alexa Fluor 647. Note the bright fluorescence intensity exhibited by the intermediate filament network, which extends throughout the cytoplasm in these fibroblast cells.
Canine Kidney Epithelial Cellular Cytoskeletal F-Actin Network with Alexa Fluor 633
Canine kidney epithelial (Madin-Darby; MDCK line) cells were stained with phalloidin conjugated to Alexa Fluor 633, which targets the intracellular cytoskeletal F-actin network. Phalloidins are a member of the phallotoxin group of bicyclic peptides isolated from the deadly Amanita phalloides mushroom.
Rat Kangaroo Cytokeratin Intermediate Filaments with Alexa Fluor 647
Examine the fluorescence emission intensity from a culture of rat kangaroo kidney epithelial cells (PtK2 line) that were immunofluorescently labeled with primary anti-cytokeratin (pan) mouse monoclonal antibodies followed by goat anti-mouse Fab fragments conjugated to Alexa Fluor 647.
Rat Kangaroo Cytokeratin Intermediate Filaments with Cy5
Compare the fluorescence emission intensity from the culture of rat kangaroo kidney cellular cytokeratin labeled with Cy5 to those listed above labeled with Alexa Fluor 647. The two fluorescent probes (Alexa Fluor 647 and Cy5) have similar absorption and emission spectral profiles and produce comparable results with the Nikon Cy5 HYQ filter combination.
Rat Kangaroo Vimentin Intermediate Filament Network with Cy5
An adherent culture of rat kangaroo kidney epithelial cells (PtK2 line) was immunofluorescently labeled with primary anti-cytokeratin (pan) mouse monoclonal antibodies followed by goat anti-mouse Fab fragments conjugated to Cy5. Note the bright fluorescence intensity exhibited by the fibrous vimentin intermediate filament network, which extends throughout the cytoplasm in these epithelial cells.
Contributing Authors
Related Nikon Products
Share this article:


