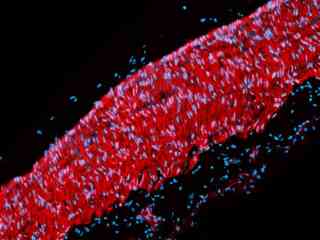
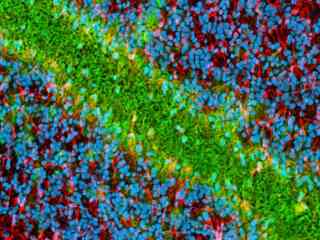
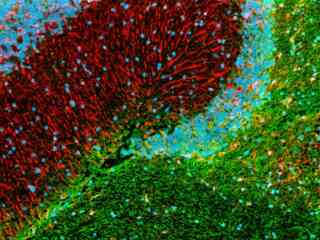
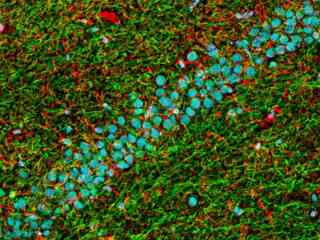
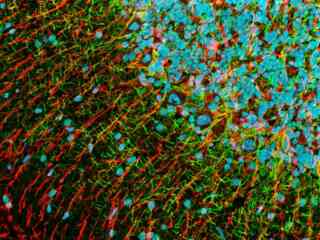
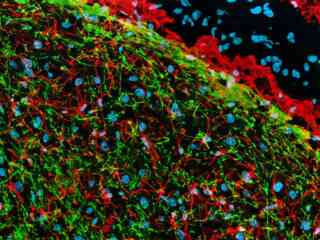
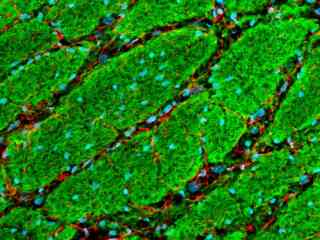
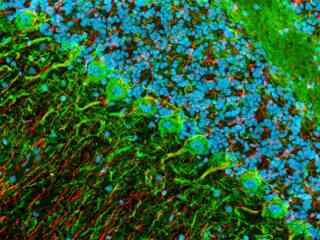
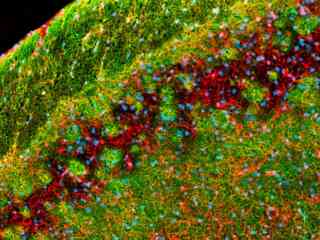
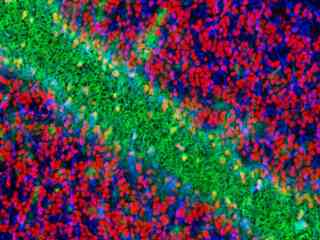
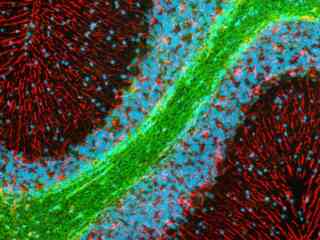
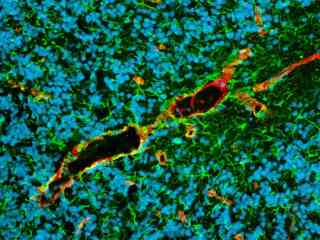
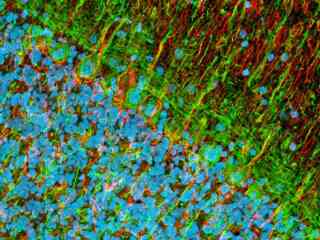
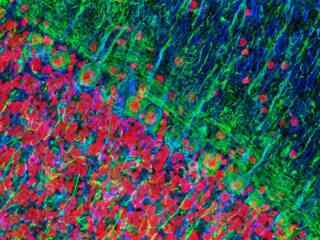
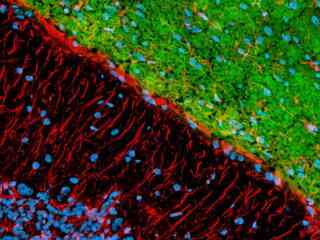
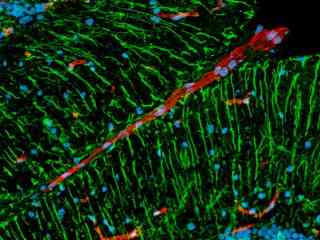
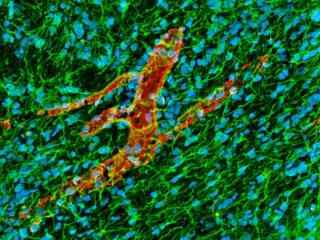
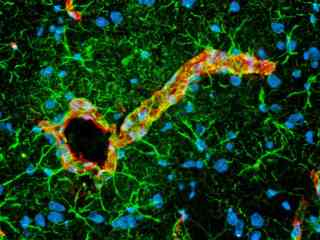
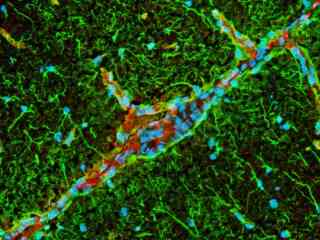
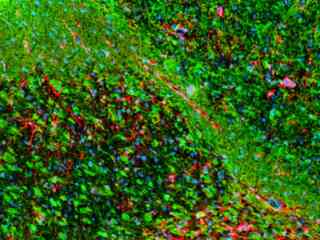
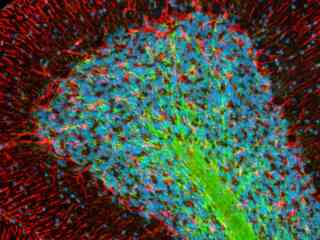
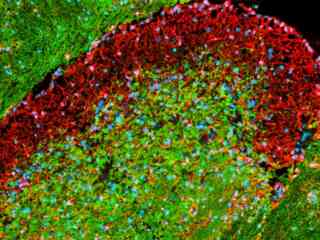
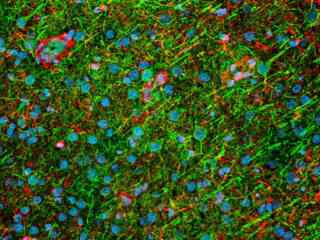
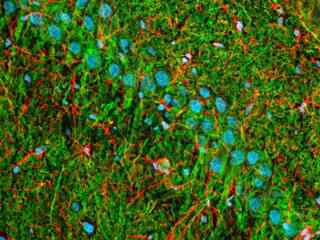
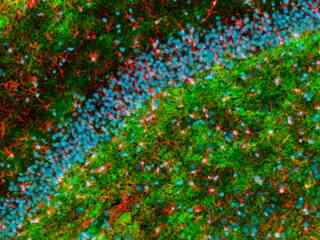
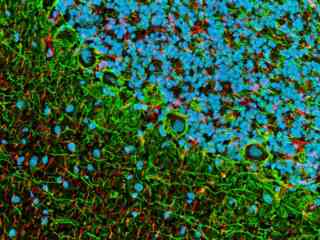
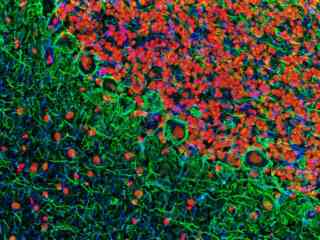
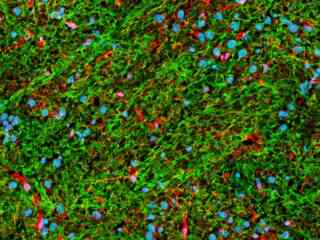
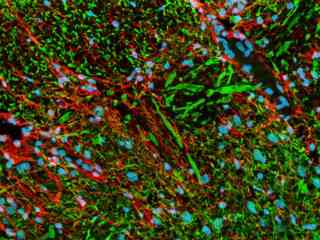
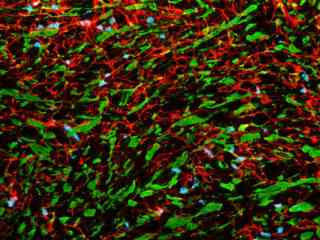
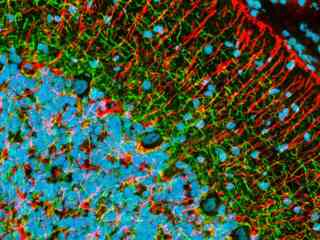
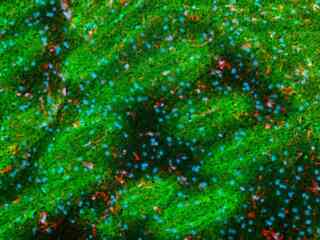
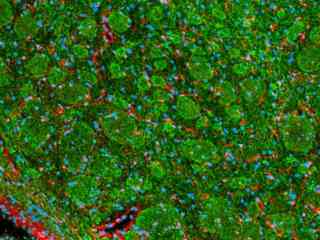
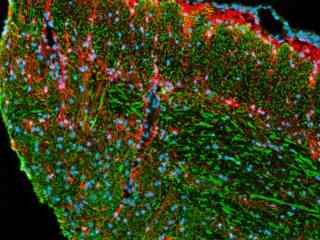
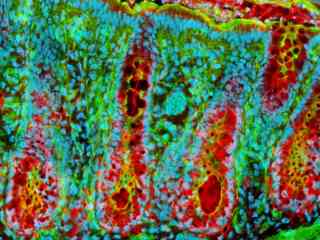
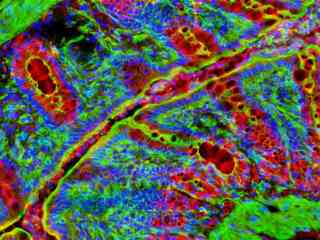
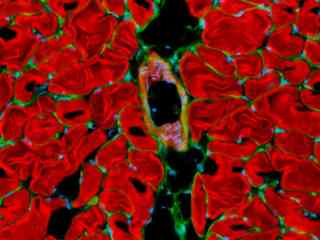
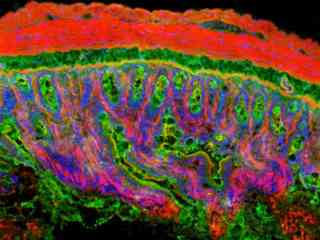
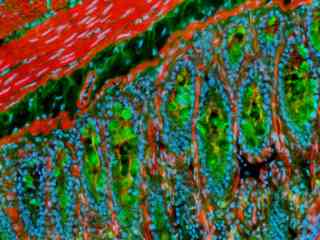
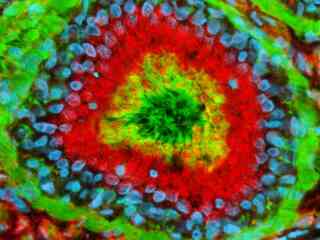
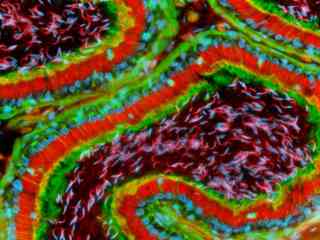
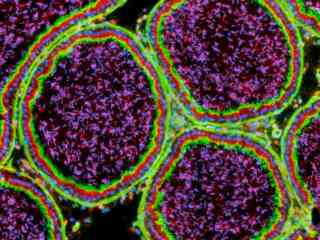
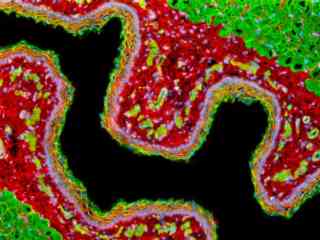
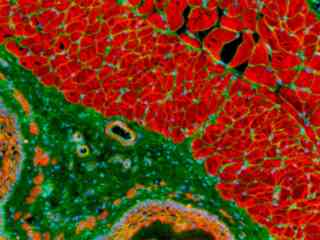
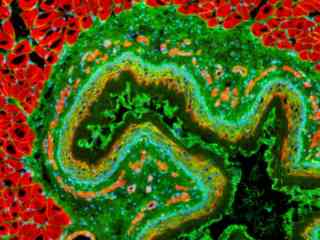
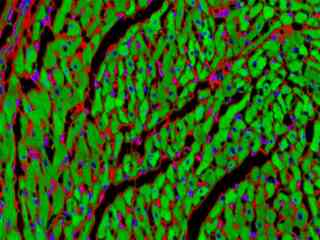
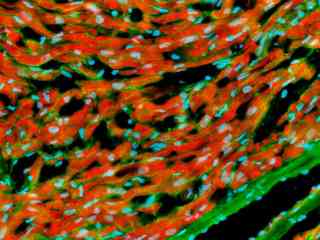
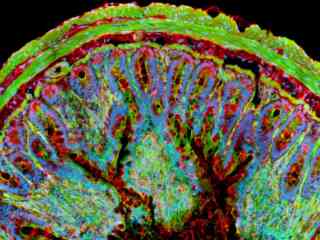
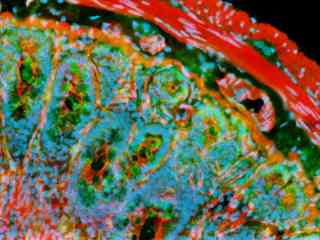
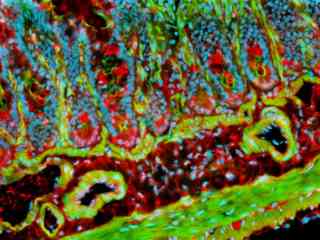
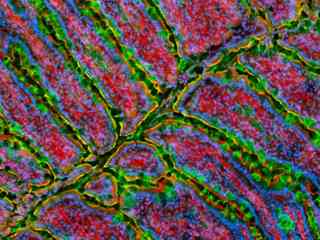
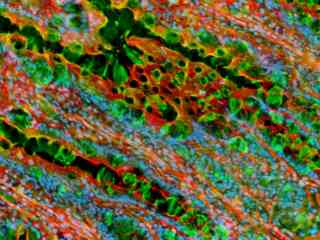
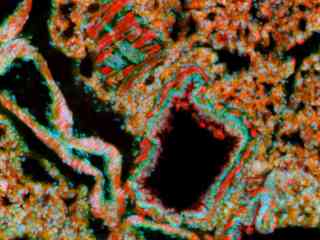
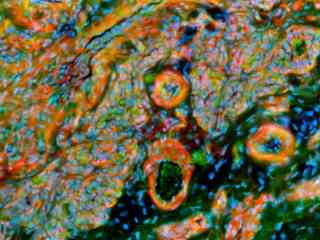
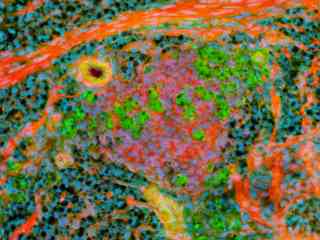
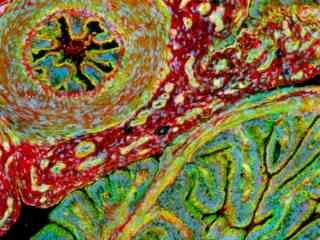
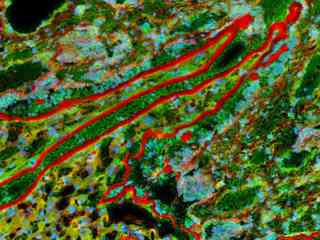
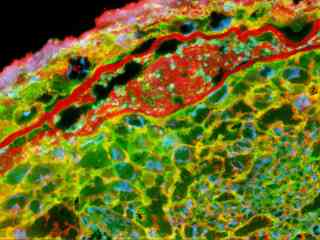
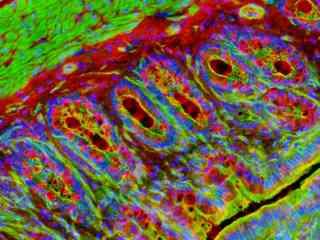
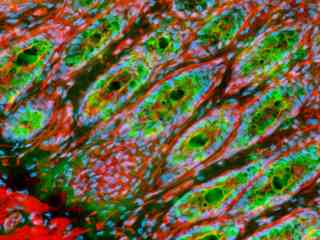
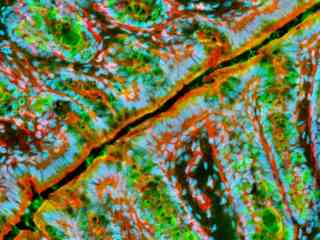
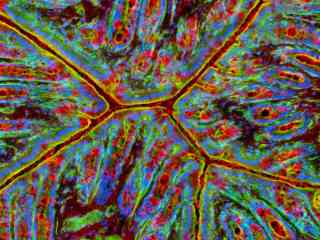
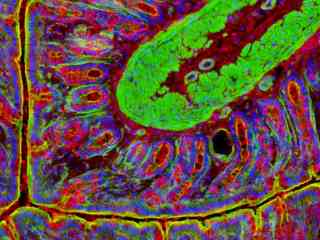
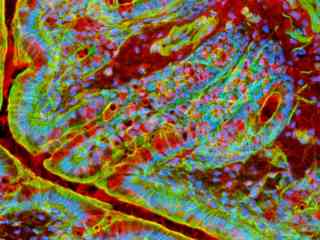
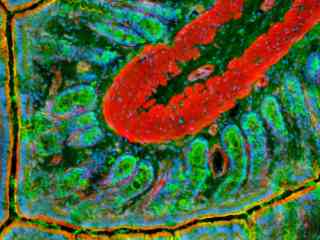
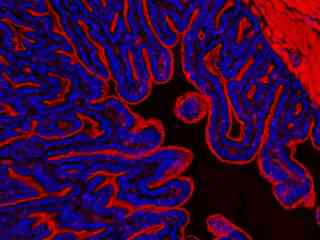
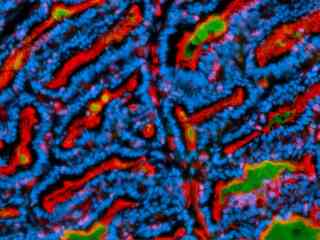
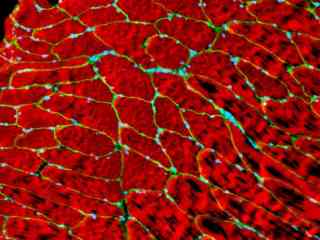
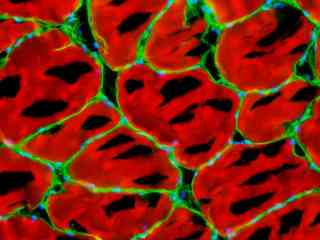
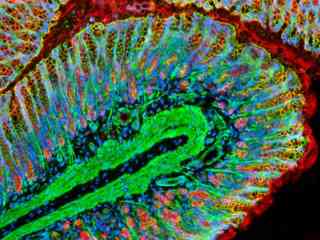
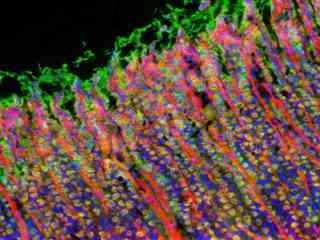
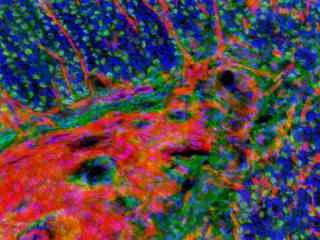
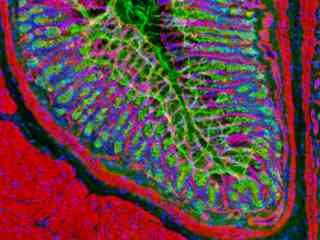
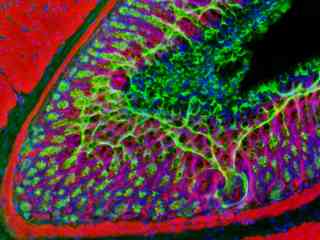
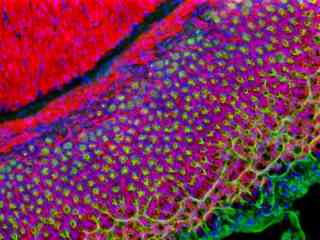
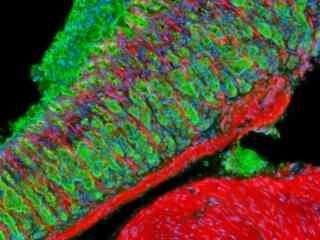
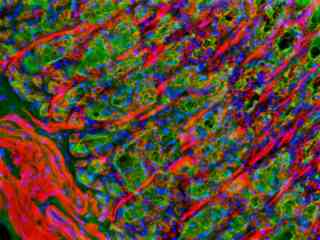
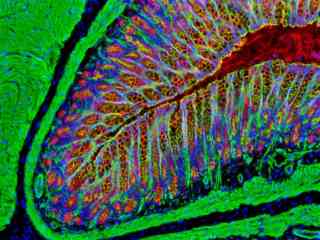
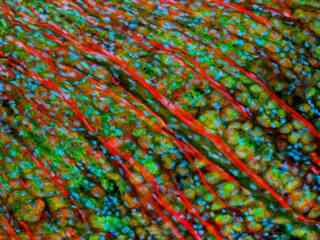
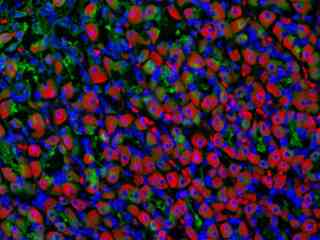
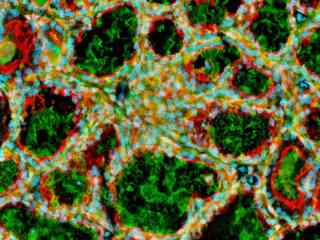
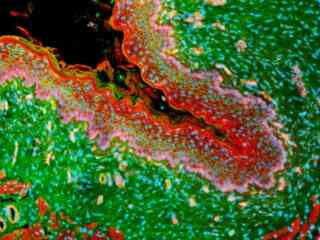
Rat Aorta Tissue Sections
The main artery of the mammalian circulatory system, the aorta is supplies oxygenated blood to the other arteries of the body. In humans, the aorta is about one inch in diameter and extends upward from the left ventricle, before arching downward through the chest. An opening in the muscular diaphragm termed the aortic hiatus allows the aorta to enter the abdomen, whence it divides into the paired common iliac arteries that extend into the legs. The wall of the aorta is composed of three tissue layers, the middle of which is thick and elastic. This elasticity enables the aorta to distend enough to accommodate the blood that surges through it as the heart contracts.
-
Rat Aorta Tissue Section
The rat aorta tissue section presented in the digital image above was labeled for the filamentous actin cytoskeletal network with Alexa Fluor 568 conjugated to phalloidin, a cyclic peptide produced by the Amanita phalloides mushroom. Cell nuclei were counterstained with Hoechst 33342. Images were recorded in grayscale with a 12-bit digital camera coupled to a Nikon Eclipse 80i microscope equipped with bandpass emission fluorescence filter optical blocks. During the processing stage, individual image channels were pseudocolored with RGB values corresponding to each of the fluorophore emission spectral profiles.
Rat Brain Tissue Sections
Much of what has been learned about the human brain has been discovered from research on the rat brain. Though smaller and less complex than that of humans, the rat brain is extremely useful as a subject of study because most regions of the brain are essentially the same among mammalian species. The rat brain has been heavily employed as an animal model for various neurological diseases, such as Parkinson's disease. In fact, it was studies of rats that led to the fundamental discovery that the Parkinson's is caused by the loss of dopamine within the brain. Research with the rodents has also been critical in testing new drug treatments for the disease, as well as investigations of other potential therapeutic approaches, such as gene therapy.
-
Rat Brain Tissue Section
Myelin basic protein, which is expressed by myelinated nerve fibers, and glial fibrillary acidic protein, a type III intermediate filament protein found primarily in astroglia, were immunofluorescently labeled in the rat brain sagittal tissue section presented above by treating the specimen with a cocktail of mouse anti-myelin BP and rabbit anti-GFAP primary antibodies followed by goat anti-mouse and anti-rabbit secondary antibodies conjugated to Alexa Fluor 488 and Alexa Fluor 568, respectively. Hoechst 33342, a dsDNA-interactive agent, was utilized to target cell nuclei. Finally, Hoechst 33342 was employed to counterstain cell nuclei. Nuclear DNA was counterstained with Hoechst 33342. Images were recorded in grayscale with a 12-bit digital camera coupled to a Nikon Eclipse 80i microscope equipped with bandpass emission fluorescence filter optical blocks. During the processing stage, individual image channels were pseudocolored with RGB values corresponding to each of the fluorophore emission spectral profiles.
-
Distribution of Myelin Basic Protein and Glial Fibrillary Acidic Protein in Rat Brain Tissue
In order to visualize myelin sheaths and astroglia in a rat brain sagittal tissue section (shown above), the specimen was immunofluorescently labeled with mouse anti-myelin BP and rabbit anti-GFAP primary antibodies followed by goat anti-mouse and anti-rabbit secondary antibodies conjugated to Alexa Fluor 488 and Alexa Fluor 568, respectively. Hoechst 33342 was employed to counterstain cell nuclei. Images were recorded in grayscale with a 12-bit digital camera coupled to a Nikon Eclipse 80i microscope equipped with bandpass emission fluorescence filter optical blocks. During the processing stage, individual image channels were pseudocolored with RGB values corresponding to each of the fluorophore emission spectral profiles.
-
Horizontal Section of Rat Brain Immunofluorescently Labeled for Phosphorylated Neurofilaments
A horizontal section of rat brain was immunofluorescently labeled for phosphorylated neurofilaments with mouse anti-NF-P antibodies followed by goat anti-mouse secondary antibodies conjugated to Alexa Fluor 488. Neurofilaments are specialized intermediate filaments solely found in neurons, especially in their axons. In addition, glial fibrillary acidic protein, which is expressed in various astroglia and neural stem cells, was targeted with rabbit anti-GFAP antibodies visualized with goat anti-rabbit secondary antibodies conjugated to Alexa Fluor 568. Cell nuclei were labeled with the popular nuclear counterstain Hoechst 33342. Images were recorded in grayscale with a 12-bit digital camera coupled to a Nikon Eclipse 80i microscope equipped with bandpass emission fluorescence filter optical blocks. During the processing stage, individual image channels were pseudocolored with RGB values corresponding to each of the fluorophore emission spectral profiles.
-
Brain Tissue Sample Triple Labeled with Alexa Fluor 488, Alexa Fluor 568, and Hoechst 33342
Immunofluorescence was utilized to label neurofilaments and astrocytes in a thin section of rat brain tissue. First, the specimen was fixed, permeabilized, blocked with 10-percent normal goat serum, and treated with a cocktail of mouse anti-NF-P (phosphorylated neurofilaments) and rabbit anti-GFAP (glial fibrillary acidic protein) primary antibodies. Then, to visualize the primary targets, the tissue section was treated with goat anti-mouse and anti-rabbit secondary antibodies (IgG) conjugated to Alexa Fluor 488 and Alexa Fluor 568, respectively. Finally, Hoechst 33342 was employed to counterstain cell nuclei. Images were recorded in grayscale with a 12-bit digital camera coupled to a Nikon Eclipse 80i microscope equipped with bandpass emission fluorescence filter optical blocks. During the processing stage, individual image channels were pseudocolored with RGB values corresponding to each of the fluorophore emission spectral profiles.
-
Targeting Neurofilaments and Astroglia in Rat Brain Sections
A rat brain sagittal section was immunofluorescently labeled for phosphorylated neurofilaments with mouse anti-NF-P monoclonal antibodies followed by goat anti-mouse secondary antibodies conjugated to Alexa Fluor 488. In addition, glial fibrillary acidic protein was targeted in the tissue section with rabbit anti-GFAP antibodies visualized with goat anti-rabbit secondaries conjugated to Alexa Fluor 568. A dsDNA probe, Hoechst 33342, was used to counterstain cell nuclei. Images were recorded in grayscale with a 12-bit digital camera coupled to a Nikon Eclipse 80i microscope equipped with bandpass emission fluorescence filter optical blocks. During the processing stage, individual image channels were pseudocolored with RGB values corresponding to each of the fluorophore emission spectral profiles.
-
Sagittal Rat Brain Sample Stained for GFAP and NF-P
A sagittal section of rat brain (shown above) was immunofluorescently labeled for phosphorylated neurofilaments (expressed in neurons) with mouse anti-NF-P antibodies followed by goat anti-mouse secondary antibodies conjugated to Alexa Fluor 488. In addition, glial fibrillary acidic protein (expressed in various astroglia and neural stem cells) was targeted with rabbit anti-GFAP antibodies visualized with goat anti-rabbit secondary antibodies conjugated to Alexa Fluor 568. Cell nuclei were labeled with the popular nuclear counterstain Hoechst 33342. Images were recorded in grayscale with a 12-bit digital camera coupled to a Nikon Eclipse 80i microscope equipped with bandpass emission fluorescence filter optical blocks. During the processing stage, individual image channels were pseudocolored with RGB values corresponding to each of the fluorophore emission spectral profiles.
-
Distribution of Neurons and Glia in Neural Tissue
This widefield fluorescence image of a rat brain tissue section was produced by probing the specimen with Alexa Fluor 488, Alexa Fluor 568, and Hoechst 33342. The two Alexa Fluor dyes were conjugated to secondary antibodies directed against primary mouse anti-NF-P antibodies and rabbit anti-GFAP antibodies in order to label phosphorylated neurofilaments expressed in neurons (Alexa Fluor 488) and glial fibrillary acidic protein in astrocytes and certain other astroglia (Alexa Fluor 568). The nuclear counterstain Hoechst 33342 was employed to visualize cell nuclei. Images were recorded in grayscale with a 12-bit digital camera coupled to a Nikon Eclipse 80i microscope equipped with bandpass emission fluorescence filter optical blocks. During the processing stage, individual image channels were pseudocolored with RGB values corresponding to each of the fluorophore emission spectral profiles.
-
Employing Immunofluorescence to Label Rat Brain Tissue for Myelin CNPase and Glial Fibrillary Acidic Protein
Glial fibrillary acidic protein and cyclic nucleotide phosphodiesterase were immunofluorescently labeled in the rat brain tissue section presented above by treating the specimen with a cocktail of rabbit anti-GFAP and mouse anti-myelin CNPase primary antibodies followed by goat anti-rabbit and anti-mouse secondary antibodies conjugated to Alexa Fluor 568 and Alexa Fluor 488, respectively. Hoechst 33342, a DNA-interactive agent, was utilized to target cell nuclei. Images were recorded in grayscale with a 12-bit digital camera coupled to a Nikon Eclipse 80i microscope equipped with bandpass emission fluorescence filter optical blocks. During the processing stage, individual image channels were pseudocolored with RGB values corresponding to each of the fluorophore emission spectral profiles.
-
Sagittal Rat Brain Section Stained with Alexa Fluor Dyes and a Popular Nuclear Counterstain
Antibodies directed against myelin CNPase detect developing and adult myelin and often serve as markers of oligodendrocytes and Schwann cells. A mouse anti-myelin CNPase antibody followed by a goat anti-mouse secondary antibody conjugated to Alexa Fluor 488 was utilized to immunofluorescently label the sagittal section of rat brain tissue presented in the digital image above. In addition, glial fibrillary acidic protein was targeted in the tissue section by treating the specimen with a rabbit anti-GFAP antibody visualized with a goat anti-rabbit secondary antibody conjugated to Alexa Fluor 568. Nuclear DNA was counterstained with Hoechst 33342. Images were recorded in grayscale with a 12-bit digital camera coupled to a Nikon Eclipse 80i microscope equipped with bandpass emission fluorescence filter optical blocks. During the processing stage, individual image channels were pseudocolored with RGB values corresponding to each of the fluorophore emission spectral profiles.
-
Glial Fibrillary Acidic Protein and Heavy Chain Neurofilament Subunits in Brain Tissue
Immunofluorescence was utilized to label neurofilaments and astrocytes in a horizontal section of rat brain tissue. First, the specimen was fixed, permeabilized, blocked with 10-percent normal goat serum, and treated with a cocktail of mouse anti-NF-H Non PO4 and rabbit anti-GFAP primary antibodies. Then, to visualize the primary targets, the tissue section was treated with goat anti-mouse and anti-rabbit secondary antibodies (IgG) conjugated to Alexa Fluor 488 and Alexa Fluor 568, respectively. Finally, Hoechst 33342 was employed to counterstain cell nuclei. Nuclear DNA was counterstained with Hoechst 33342. Images were recorded in grayscale with a 12-bit digital camera coupled to a Nikon Eclipse 80i microscope equipped with bandpass emission fluorescence filter optical blocks. During the processing stage, individual image channels were pseudocolored with RGB values corresponding to each of the fluorophore emission spectral profiles.
-
Neural Tissue Labeled for GFAP, Myelin BP, and DNA
Myelin basic protein, which is a marker for the fatty sheaths surrounding the axons of myelinated nerve fibers, and glial fibrillary acidic protein, a type III intermediate filament protein found primarily in astroglia, were immunofluorescently labeled in the rat brain sagittal tissue section presented above by treating the specimen with a cocktail of mouse anti-myelin BP and rabbit anti-GFAP primary antibodies followed by goat anti-mouse and anti-rabbit secondary antibodies conjugated to Alexa Fluor 488 and Alexa Fluor 568, respectively. Hoechst 33342, a dsDNA-interactive agent, was utilized to target cell nuclei. Images were recorded in grayscale with a 12-bit digital camera coupled to a Nikon Eclipse 80i microscope equipped with bandpass emission fluorescence filter optical blocks. During the processing stage, individual image channels were pseudocolored with RGB values corresponding to each of the fluorophore emission spectral profiles.
-
Localizing Fluorescent Tags to Myelinated Nerve Fibers in Brain Tissue Samples
The rat brain tissue specimen above was fixed, permeabilized, blocked with 10-percent normal goat serum, and then treated with rabbit anti-GFAP (astroglia and neural stem cells) and mouse anti-myelin BP (myelinated nerve fibers) primary antibodies followed by goat anti-rabbit and anti-mouse secondary antibodies (IgG) conjugated to Alexa Fluor 568 and Alexa Fluor 488, respectively. Nuclei in the tissue section were subsequently targeted with Hoechst 33342. Images were recorded in grayscale with a 12-bit digital camera coupled to a Nikon Eclipse 80i microscope equipped with bandpass emission fluorescence filter optical blocks. During the processing stage, individual image channels were pseudocolored with RGB values corresponding to each of the fluorophore emission spectral profiles, with the exception of Alexa Fluor 568, which was pseudocolored blue, and Hoechst 33342, which was pseudocolored red.
-
Strata of the Rat Brain Visualized with Double Immunofluorescence and Synthetic Fluorophores
In order to visualize myelin sheaths and astroglia in a rat brain sagittal tissue section (illustrated above), the specimen was immunofluorescently labeled with mouse anti-myelin BP and rabbit anti-GFAP primary antibodies followed by goat anti-mouse and anti-rabbit secondary antibodies conjugated to Alexa Fluor 488 and Alexa Fluor 568, respectively. Hoechst 33342 was employed to counterstain cell nuclei. Images were recorded in grayscale with a 12-bit digital camera coupled to a Nikon Eclipse 80i microscope equipped with bandpass emission fluorescence filter optical blocks. During the processing stage, individual image channels were pseudocolored with RGB values corresponding to each of the fluorophore emission spectral profiles.
-
The Blood Brain Barrier Targeted in a Sagittal Tissue Section
Immunofluorescence was utilized to target the blood brain barrier (BBB) and astroglia in a sagittal section of rat brain tissue. First, the specimen was fixed, permeabilized, blocked with 10-percent normal goat serum, and treated with a cocktail of mouse anti-BBB and rabbit anti-GFAP primary antibodies. Then, to visualize the primary targets, the tissue section was treated with goat anti-mouse and anti-rabbit secondary antibodies (IgG) conjugated to Alexa Fluor 568 and Alexa Fluor 488, respectively. Finally, cell nuclei were labeled with Hoechst 33342. Images were recorded in grayscale with a 12-bit digital camera coupled to a Nikon Eclipse 80i microscope equipped with bandpass emission fluorescence filter optical blocks. During the processing stage, individual image channels were pseudocolored with RGB values corresponding to each of the fluorophore emission spectral profiles.
-
Distribution of Neurofilament Protein and Glial Fibrillary Acidic Protein in Samples of Rat Brain Tissue
This widefield fluorescence image of a rat brain tissue section was produced by probing the specimen with Alexa Fluor 488, Alexa Fluor 568, and Hoechst 33342. The two Alexa Fluor dyes were conjugated to secondary antibodies directed against primary mouse anti-NF-P antibodies and rabbit anti-GFAP antibodies in order to label phosphorylated neurofilaments expressed in neurons (Alexa Fluor 488) and glial fibrillary acidic protein in astrocytes and certain other astroglia (Alexa Fluor 568). The nuclear counterstain Hoechst 33342 was employed to visualize cell nuclei. Images were recorded in grayscale with a 12-bit digital camera coupled to a Nikon Eclipse 80i microscope equipped with bandpass emission fluorescence filter optical blocks. During the processing stage, individual image channels were pseudocolored with RGB values corresponding to each of the fluorophore emission spectral profiles.
-
Targeting Neurofilaments and Astroglia in a Sagittal Brain Section with Immunofluorescence
A sagittal section of rat brain (shown above) was immunofluorescently labeled for phosphorylated neurofilaments (expressed in neurons) with mouse anti-NF-P antibodies followed by goat anti-mouse secondary antibodies conjugated to Alexa Fluor 488. In addition, glial fibrillary acidic protein (expressed in various astroglia and neural stem cells) was targeted with rabbit anti-GFAP antibodies visualized with goat anti-rabbit secondary antibodies conjugated to Alexa Fluor 568. Cell nuclei were labeled with the popular nuclear counterstain Hoechst 33342. Images were recorded in grayscale with a 12-bit digital camera coupled to a Nikon Eclipse 80i microscope equipped with bandpass emission fluorescence filter optical blocks. During the processing stage, individual image channels were pseudocolored with RGB values corresponding to each of the fluorophore emission spectral profiles.
-
Rat Brain Tissue Immunofluorescently Labeled for Myelin Binding Protein and GFAP
Myelin basic protein, which is expressed in the fatty sheaths surrounding the axons of myelinated nerve fibers, and glial fibrillary acidic protein, a type III intermediate filament protein found primarily in astroglia, were immunofluorescently labeled in the rat brain sagittal tissue section presented above by treating the specimen with a cocktail of mouse anti-myelin BP and rabbit anti-GFAP primary antibodies followed by goat anti-mouse and anti-rabbit secondary antibodies conjugated to Alexa Fluor 488 and Alexa Fluor 568, respectively. Hoechst 33342, a dsDNA-interactive agent, was utilized to target cell nuclei. Images were recorded in grayscale with a 12-bit digital camera coupled to a Nikon Eclipse 80i microscope equipped with bandpass emission fluorescence filter optical blocks. During the processing stage, individual image channels were pseudocolored with RGB values corresponding to each of the fluorophore emission spectral profiles, with the exception of Alexa Fluor 568, which was pseudocolored blue, and Hoechst 33342, which was pseudocolored red.
-
Visualizing the Blood Brain Barrier in Rat CNS Tissue
A sagittal section of rat brain (presented above) was immunofluorescently labeled for the blood brain barrier with mouse anti-BBB antibodies followed by goat anti-mouse secondary antibodies conjugated to Alexa Fluor 568. In addition, glial fibrillary acidic protein (GFAP), which is strongly and specifically expressed in various astroglia and neural stem cells, was targeted in the specimen with rabbit anti-GFAP monoclonal antibodies visualized with goat anti-rabbit antibodies conjugated to Alexa Fluor 488. Nuclear DNA was counterstained with Hoechst 33342. Images were recorded in grayscale with a 12-bit digital camera coupled to a Nikon Eclipse 80i microscope equipped with bandpass emission fluorescence filter optical blocks. During the processing stage, individual image channels were pseudocolored with RGB values corresponding to each of the fluorophore emission spectral profiles.
-
Brain Sagittal Section Triple Labeled with Alexa Fluor 488, Alexa Fluor 568, and Hoechst 33342
In a double immunofluorescence experiment, rat brain tissue section illustrated above was fixed, permeabilized, blocked with 10-percent normal goat serum, and then treated with a cocktail of mouse anti-BBB (blood brain barrier) and rabbit anti-GFAP (glial fibrillary acidic protein) primary antibodies followed by goat anti-mouse and anti-rabbit secondary antibodies (IgG) conjugated to Alexa Fluor 568 and Alexa Fluor 488, respectively. DNA in the cell nucleus was counterstained with Hoechst 33342. Images were recorded in grayscale with a 12-bit digital camera coupled to a Nikon Eclipse 80i microscope equipped with bandpass emission fluorescence filter optical blocks. During the processing stage, individual image channels were pseudocolored with RGB values corresponding to each of the fluorophore emission spectral profiles.
-
Neural Tissue Labeled for GFAP, BBB, and DNA
In order to visualize components of the blood brain barrier and astroglia in a rat brain sagittal tissue section (shown above), the specimen was immunofluorescently labeled with mouse anti-BBB and rabbit anti-GFAP primary antibodies followed by goat anti-mouse and anti-rabbit secondary antibodies conjugated to Alexa Fluor 568 and Alexa Fluor 488, respectively. Hoechst 33342 was employed to counterstain cell nuclei. Images were recorded in grayscale with a 12-bit digital camera coupled to a Nikon Eclipse 80i microscope equipped with bandpass emission fluorescence filter optical blocks. During the processing stage, individual image channels were pseudocolored with RGB values corresponding to each of the fluorophore emission spectral profiles.
-
Localizing Fluorescent Tags to the Blood Brain Barrier and Glial Cells in Rat Brain Tissue Samples
Immunofluorescence was utilized to target the blood brain barrier (BBB) and astroglia in a sagittal section of rat brain tissue. First, the specimen was fixed, permeabilized, blocked with 10-percent normal goat serum, and treated with a cocktail of mouse anti-BBB and rabbit anti-GFAP primary antibodies. Then, to visualize the primary targets, the tissue section was treated with goat anti-mouse and anti-rabbit secondary antibodies (IgG) conjugated to Alexa Fluor 568 and Alexa Fluor 488, respectively. Finally, cell nuclei were labeled with Hoechst 33342. Images were recorded in grayscale with a 12-bit digital camera coupled to a Nikon Eclipse 80i microscope equipped with bandpass emission fluorescence filter optical blocks. During the processing stage, individual image channels were pseudocolored with RGB values corresponding to each of the fluorophore emission spectral profiles.
-
Myelinated Nerve Fibers and Astroglia Visualized in a Sagittal Section of Rat Brain
Myelin was targeted in the sagittal rat brain section presented above with mouse anti-myelin CNPase antibodies followed by goat anti-mouse secondary antibodies conjugated to Alexa Fluor 488. In addition, glial fibrillary acidic protein was targeted in the tissue section by treating the specimen with rabbit anti-GFAP antibodies visualized with goat anti-rabbit secondary antibodies conjugated to Alexa Fluor 568. Nuclear DNA was counterstained with Hoechst 33342. Images were recorded in grayscale with a 12-bit digital camera coupled to a Nikon Eclipse 80i microscope equipped with bandpass emission fluorescence filter optical blocks. During the processing stage, individual image channels were pseudocolored with RGB values corresponding to each of the fluorophore emission spectral profiles.
-
Targeting Nerve Cell Sheaths with Anti-Myelin CNPase Antibodies
Glial fibrillary acidic protein and cyclic nucleotide phosphodiesterase were immunofluorescently labeled in a rat brain tissue section (illustrated above) by treating the specimen with a cocktail of rabbit anti-GFAP and mouse anti-myelin CNPase primary antibodies followed by goat anti-rabbit and anti-mouse secondary antibodies conjugated to Alexa Fluor 568 and Alexa Fluor 488, respectively. Hoechst 33342, a DNA-interactive agent, was utilized to visualize cell nuclei. Images were recorded in grayscale with a 12-bit digital camera coupled to a Nikon Eclipse 80i microscope equipped with bandpass emission fluorescence filter optical blocks. During the processing stage, individual image channels were pseudocolored with RGB values corresponding to each of the fluorophore emission spectral profiles.
-
Immunofluorescently Labeled Myelin and Astroglia in a Sagittal Section of Rat Brain Tissue
Immunofluorescence was utilized to target myelin and astroglia in a sagittal section of rat brain tissue. First, the specimen was fixed, permeabilized, blocked with 10-percent normal goat serum, and treated with a cocktail of mouse anti-myelin CNPase and rabbit anti-GFAP primary antibodies. Next, to visualize the primary targets, the tissue section was treated with goat anti-mouse and anti-rabbit secondary antibodies (IgG) conjugated to Alexa Fluor 488 and Alexa Fluor 568, respectively. Finally, cell nuclei were labeled with Hoechst 33342. Images were recorded in grayscale with a 12-bit digital camera coupled to a Nikon Eclipse 80i microscope equipped with bandpass emission fluorescence filter optical blocks. During the processing stage, individual image channels were pseudocolored with RGB values corresponding to each of the fluorophore emission spectral profiles.
-
Glial Fibrillary Acidic Protein and Heavy Chain Neurofilament Subunits in a Horizontal Tissue Section
Neurofilaments, which are found specifically in neurons and are especially prominent in the axons of the cells, were targeted in a rat brain horizontal section (shown above) with mouse anti-NF-H Non PO4 antibodies followed by goat anti-mouse secondary antibodies conjugated to Alexa Fluor 488. The glial fibrillary acidic protein was simultaneously targeted in the specimen with mouse anti-GFAP antibodies visualized with goat anti-rabbit secondary antibodies conjugated to Alexa Fluor 568. Nuclear DNA was subsequently labeled with Hoechst 33342. Images were recorded in grayscale with a 12-bit digital camera coupled to a Nikon Eclipse 80i microscope equipped with bandpass emission fluorescence filter optical blocks. During the processing stage, individual image channels were pseudocolored with RGB values corresponding to each of the fluorophore emission spectral profiles.
-
Brain Tissue Sample Probed with Alexa Fluor 488, Alexa Fluor 568, and Hoechst 33342
The horizontal section of rat brain depicted above was immunofluorescently labeled for neurofilaments with mouse anti-NF-H Non PO4 antibodies followed by goat anti-mouse secondary antibodies conjugated to Alexa Fluor 488. In addition, glial fibrillary acidic protein (expressed in various astroglia and neural stem cells) was targeted with rabbit anti-GFAP antibodies visualized with goat anti-rabbit secondary antibodies conjugated to Alexa Fluor 568. Cell nuclei were labeled with the popular nuclear counterstain Hoechst 33342. Images were recorded in grayscale with a 12-bit digital camera coupled to a Nikon Eclipse 80i microscope equipped with bandpass emission fluorescence filter optical blocks. During the processing stage, individual image channels were pseudocolored with RGB values corresponding to each of the fluorophore emission spectral profiles.
-
Distribution of Myelin Basic Protein and GFAP in a Sagittal Section
Myelin basic protein, which is expressed in myelin axon sheaths, and glial fibrillary acidic protein, a type III intermediate filament protein found primarily in astroglia, were immunofluorescently labeled in the rat brain sagittal tissue section presented above by treating the specimen with a cocktail of mouse anti-myelin BP and rabbit anti-GFAP primary antibodies followed by goat anti-mouse and anti-rabbit secondary antibodies conjugated to Alexa Fluor 488 and Alexa Fluor 568, respectively. Hoechst 33342, a dsDNA-interactive agent, was utilized to target cell nuclei. Images were recorded in grayscale with a 12-bit digital camera coupled to a Nikon Eclipse 80i microscope equipped with bandpass emission fluorescence filter optical blocks. During the processing stage, individual image channels were pseudocolored with RGB values corresponding to each of the fluorophore emission spectral profiles.
-
Localizing Fluorescent Tags to Neurofilaments and Astroglia in Brain Samples
In a double immunofluorescence experiment, this sagittal section of rat brain was fixed, permeabilized, blocked with 10-percent normal goat serum, and then treated with primary mouse antibodies against NF-P (phosphorylated neurofilaments) and rabbit antibodies against GFAP (glial fibrillary acidic protein). The primary targets were then visualized with goat anti-mouse secondary antibodies conjugated to Alexa Fluor 488 and anti-rabbit antibodies conjugated to Alexa Fluor 568. Hoechst 33342 was employed as a nuclear counterstain. Images were recorded in grayscale with a 12-bit digital camera coupled to a Nikon Eclipse 80i microscope equipped with bandpass emission fluorescence filter optical blocks. During the processing stage, individual image channels were pseudocolored with RGB values corresponding to each of the fluorophore emission spectral profiles.
-
Neurons, Glial Cells, and DNA Visualized in a Sagittal Rat Brain Tissue Section
A sagittal section of rat brain was immunofluorescently labeled for phosphorylated neurofilaments with mouse anti-NF-P antibodies followed by goat anti-mouse secondary antibodies conjugated to Alexa Fluor 488. Neurofilaments are specialized intermediate filaments solely found in neurons, especially in their axons. In addition, glial fibrillary acidic protein, which is expressed in various astroglia and neural stem cells, was targeted with rabbit anti-GFAP antibodies visualized with goat anti-rabbit secondary antibodies conjugated to Alexa Fluor 568. Cell nuclei were labeled with the popular nuclear counterstain Hoechst 33342. Images were recorded in grayscale with a 12-bit digital camera coupled to a Nikon Eclipse 80i microscope equipped with bandpass emission fluorescence filter optical blocks. During the processing stage, individual image channels were pseudocolored with RGB values corresponding to each of the fluorophore emission spectral profiles.
-
Detecting NF-P and GFAP in Brain Samples with Immunofluorescence
Immunofluorescence was utilized to label neurofilaments and astrocytes in a section of rat brain tissue (presented above). First, the specimen was fixed, permeabilized, blocked with 10-percent normal goat serum, and treated with a cocktail of mouse anti-NF-P (phosphorylated neurofilaments) and rabbit anti-GFAP (glial fibrillary acidic protein) primary antibodies. Then, to visualize the primary targets, the tissue section was treated with goat anti-mouse and anti-rabbit secondary antibodies (IgG) conjugated to Alexa Fluor 488 and Alexa Fluor 568, respectively. Finally, Hoechst 33342 was employed to counterstain cell nuclei. Images were recorded in grayscale with a 12-bit digital camera coupled to a Nikon Eclipse 80i microscope equipped with bandpass emission fluorescence filter optical blocks. During the processing stage, individual image channels were pseudocolored with RGB values corresponding to each of the fluorophore emission spectral profiles.
-
Rat Brain Sagittal Section Stained with a Combination of Alexa Fluor dyes and Hoechst 33342
The sagittal section of rat brain depicted above was immunofluorescently labeled for glial fibrillary acidic protein (expressed in various astroglia and neural stem cells) with rabbit anti-GFAP antibodies visualized with goat anti-rabbit secondary antibodies conjugated to Alexa Fluor 568. In addition, to target neurofilaments, the specimen was treated with mouse anti-NF-P antibodies followed by goat anti-mouse secondary antibodies conjugated to Alexa Fluor 488. DNA was labeled with the popular nuclear counterstain Hoechst 33342. Images were recorded in grayscale with a 12-bit digital camera coupled to a Nikon Eclipse 80i microscope equipped with bandpass emission fluorescence filter optical blocks. During the processing stage, individual image channels were pseudocolored with RGB values corresponding to each of the fluorophore emission spectral profiles.
-
Utilizing Antibodies to Target Neurofilaments and Astrocytes
This widefield fluorescence image of a rat brain tissue section was produced by probing the specimen with Alexa Fluor 488, Alexa Fluor 568, and Hoechst 33342. The two Alexa Fluor dyes were conjugated to secondary antibodies directed against primary mouse anti-NF-P antibodies and rabbit anti-GFAP antibodies in order to label phosphorylated neurofilaments expressed in neurons (Alexa Fluor 488) and glial fibrillary acidic protein in astrocytes and certain other astroglia (Alexa Fluor 568). The nuclear counterstain Hoechst 33342 was employed to visualize cell nuclei. Images were recorded in grayscale with a 12-bit digital camera coupled to a Nikon Eclipse 80i microscope equipped with bandpass emission fluorescence filter optical blocks. During the processing stage, individual image channels were pseudocolored with RGB values corresponding to each of the fluorophore emission spectral profiles.
-
Strata of a Horizontal Rat Brain Section Revealed with Alexa Fluor Conjugates
Neurofilaments, which are found specifically in neurons and are especially prominent in the axons of the cells, were targeted in a rat brain horizontal section (shown above) with mouse anti-NF-P antibodies followed by goat anti-mouse secondary antibodies conjugated to Alexa Fluor 488. The glial fibrillary acidic protein was simultaneously targeted in the specimen with mouse anti-GFAP antibodies visualized with goat anti-rabbit secondary antibodies conjugated to Alexa Fluor 568. Nuclear DNA was subsequently labeled with Hoechst 33342. Images were recorded in grayscale with a 12-bit digital camera coupled to a Nikon Eclipse 80i microscope equipped with bandpass emission fluorescence filter optical blocks. During the processing stage, individual image channels were pseudocolored with RGB values corresponding to each of the fluorophore emission spectral profiles.
-
Brain Tissue Sample Labeled for GFAP, NF-P, and DNA
In order to visualize neurons and astroglia in a rat brain horizontal tissue section (shown above), the specimen was immunofluorescently labeled with mouse anti-NF-P and rabbit anti-GFAP primary antibodies followed by goat anti-mouse and anti-rabbit secondary antibodies conjugated to Alexa Fluor 568 (pseudocolored blue) and Alexa Fluor 488, respectively. Hoechst 33342 (pseudocolored red) was employed to counterstain cell nuclei. Images were recorded in grayscale with a 12-bit digital camera coupled to a Nikon Eclipse 80i microscope equipped with bandpass emission fluorescence filter optical blocks. During the processing stage, individual image channels were pseudocolored with RGB values corresponding to each of the fluorophore emission spectral profiles unless otherwise noted above.
-
Distribution of Glia and Neurons in a Horizontal Section of Rat Brain
Glial fibrillary acidic protein and phosphorylated neurofilaments were immunofluorescently labeled in the rat brain tissue section presented above by treating the specimen with a cocktail of rabbit anti-GFAP and mouse anti-NF-P primary antibodies followed by goat anti-rabbit and anti-mouse secondary antibodies conjugated to Alexa Fluor 568 and Alexa Fluor 488, respectively. Hoechst 33342, a DNA-interactive agent, was utilized to target cell nuclei. Images were recorded in grayscale with a 12-bit digital camera coupled to a Nikon Eclipse 80i microscope equipped with bandpass emission fluorescence filter optical blocks. During the processing stage, individual image channels were pseudocolored with RGB values corresponding to each of the fluorophore emission spectral profiles.
-
Immunofluorescently Labeled Neurofilament Protein and Glial Fibrillary Acidic Protein in CNS Tissue
In a double immunofluorescence experiment, this horizontal section of rat brain was fixed, permeabilized, blocked with 10-percent normal goat serum, and then treated with primary mouse antibodies against NF-P (phosphorylated neurofilaments) and rabbit antibodies against GFAP (glial fibrillary acidic protein). The primary targets were then visualized with goat anti-mouse secondary antibodies conjugated to Alexa Fluor 488 and anti-rabbit antibodies conjugated to Alexa Fluor 568. Hoechst 33342 was employed as a nuclear counterstain. Images were recorded in grayscale with a 12-bit digital camera coupled to a Nikon Eclipse 80i microscope equipped with bandpass emission fluorescence filter optical blocks. During the processing stage, individual image channels were pseudocolored with RGB values corresponding to each of the fluorophore emission spectral profiles.
-
Sagittal Rat Brain Section Stained for Myelin Binding Protein, GFAP, and Nuclear DNA
Myelin was targeted in the sagittal rat brain section presented above with mouse anti-myelin BP antibodies followed by goat anti-mouse secondary antibodies conjugated to Alexa Fluor 488. In addition, glial fibrillary acidic protein was targeted in the tissue section by treating the specimen with rabbit anti-GFAP antibodies visualized with goat anti-rabbit secondary antibodies conjugated to Alexa Fluor 568 (pseudocolored blue). Nuclear DNA was counterstained with Hoechst 33342 (pseudocolored red). Images were recorded in grayscale with a 12-bit digital camera coupled to a Nikon Eclipse 80i microscope equipped with bandpass emission fluorescence filter optical blocks. During the processing stage, individual image channels were pseudocolored with RGB values corresponding to each of the fluorophore emission spectral profiles unless otherwise noted above.
-
Employing Double Immunofluorescence to Label Rat Brain Tissue for Neurofilaments and Glial Cells
Neurofilaments, which are found specifically in neurons and are especially prominent in the axons of the cells, were targeted in a rat brain horizontal section (shown above) with mouse anti-NF-P antibodies followed by goat anti-mouse secondary antibodies conjugated to Alexa Fluor 488. Glial fibrillary acidic protein was simultaneously targeted in the specimen with mouse anti-GFAP antibodies visualized with goat anti-rabbit secondary antibodies conjugated to Alexa Fluor 568. Nuclear DNA was subsequently labeled with Hoechst 33342. Images were recorded in grayscale with a 12-bit digital camera coupled to a Nikon Eclipse 80i microscope equipped with bandpass emission fluorescence filter optical blocks. During the processing stage, individual image channels were pseudocolored with RGB values corresponding to each of the fluorophore emission spectral profiles.
-
Brain Tissue Labeled with Alexa Fluor 488, Alexa Fluor 568, and Hoechst 33342
A sagittal section of rat brain (presented above) was immunofluorescently labeled for phosphorylated neurofilaments with mouse anti-NF-P antibodies followed by goat anti-mouse secondary antibodies conjugated to Alexa Fluor 488. In addition, glial fibrillary acidic protein (GFAP), which is strongly and specifically expressed in various astroglia and neural stem cells, was targeted in the specimen with rabbit anti-GFAP monoclonal antibodies visualized with goat anti-rabbit antibodies conjugated to Alexa Fluor 568. Nuclear DNA was counterstained with Hoechst 33342. Images were recorded in grayscale with a 12-bit digital camera coupled to a Nikon Eclipse 80i microscope equipped with bandpass emission fluorescence filter optical blocks. During the processing stage, individual image channels were pseudocolored with RGB values corresponding to each of the fluorophore emission spectral profiles.
Rat Colon Tissue Sections
Commonly referred to as the large intestine, the colon is a muscular tube-like component of the digestive system. The colon extends from the small intestine to the anal opening and is about five feet long in a human adult. Six main sections comprise the mammalian colon: the cecum, ascending colon, transverse colon, descending colon, sigmoid colon, and rectum. Though there are some differences in the function of the colon in different species, the organ primarily acts as a temporary repository for waste products and as a site of water absorption. A few vitamins are also absorbed by the colon, though no digestive enzymes are present in the large intestine and most nutritive components of digested material have been removed by the time this part of the digestive system is reached.
-
Rat Colon Tissue Section
The sample of rat colon tissue presented in the digital image above was labeled with Texas Red conjugated to wheat germ agglutinin, a lectin that selectively binds N-acetylglucosamine and sialic acid residues. The specimen was also labeled with Alexa Fluor 488 conjugated to phalloidin and Hoechst 33342, targeting F-actin and nuclear DNA, respectively. Images were recorded in grayscale with a 12-bit digital camera coupled to a Nikon Eclipse 80i microscope equipped with bandpass emission fluorescence filter optical blocks. During the processing stage, individual image channels were pseudocolored with RGB values corresponding to each of the fluorophore emission spectral profiles.
-
Rat Colon Tissue Labeled with Wheat Germ Agglutinin
In order to localize a red fluorescent tag to filamentous actin in the sample of rat colon tissue presented in the digital image above, the specimen was labeled with Alexa Fluor 568 conjugated to phalloidin, a phallotoxin commonly utilized in cell biology. Oregon Green 488 conjugated to the lectin wheat germ agglutinin, which selectively binds to N-acetylglucosamine and N-acetylneuraminic residues, was also applied to the tissue sample, as was the DNA probe Hoechst 33342. Images were recorded in grayscale with a 12-bit digital camera coupled to a Nikon Eclipse 80i microscope equipped with bandpass emission fluorescence filter optical blocks. During the processing stage, individual image channels were pseudocolored with RGB values corresponding to each of the fluorophore emission spectral profiles.
-
Rat Colon Tissue Labeled with Wheat Germ Agglutinin Conjugated to Oregon Green 488
The rat colon tissue section illustrated in the digital image above was labeled with wheat germ agglutinin (WGA) conjugated to Oregon Green 488. WGA, which selectively binds to N-acetylglucosamine and N-acetylneuraminic (sialic acid) residues, is well suited for staining the Golgi network in fixed cells and tissues since a number of proteins and lipids found in the Golgi apparatus are glycosylated. The specimen was also labeled with Alexa Fluor 568 conjugated to phalloidin (targeting F-actin) and Hoechst 33342 (targeting DNA in the nucleus). Images were recorded in grayscale with a 12-bit digital camera coupled to a Nikon Eclipse 80i microscope equipped with bandpass emission fluorescence filter optical blocks. During the processing stage, individual image channels were pseudocolored with RGB values corresponding to each of the fluorophore emission spectral profiles.
-
Golgi Networks and F-Actin Visualized in a Rat Colon Sample
In order to visualize lectin binding to the Golgi complex in a sample of rat colon, the tissue section above was treated with wheat germ agglutinin conjugated to Texas Red. The cells were subsequently counterstained with Alexa Fluor 488 conjugated to phalloidin to localize the filamentous actin network, and the nucleic acid stain Hoechst 33332 to label DNA in the nucleus. Images were recorded in grayscale with a 12-bit digital camera coupled to a Nikon Eclipse 80i microscope equipped with bandpass emission fluorescence filter optical blocks. During the processing stage, individual image channels were pseudocolored with RGB values corresponding to each of the fluorophore emission spectral profiles.
-
Labeling Colon Tissue with Fluorescent Probes Conjugated to Phallotoxins and Lectins
In the digital image above, a rat colon tissue section is presented that was labeled with the fluorophore Texas Red conjugated to wheat germ agglutinin, a fluorescent lectin that selectively binds to sialic acid residues. Wheat germ agglutinin conjugates are often used as probes for the Golgi network in mammalian tissues and cells. The sample was also stained with Alexa Fluor 488 conjugated to phalloidin and Hoechst 33342, which target F-actin and DNA, respectively. Images were recorded in grayscale with a 12-bit digital camera coupled to a Nikon Eclipse 80i microscope equipped with bandpass emission fluorescence filter optical blocks. During the processing stage, individual image channels were pseudocolored with RGB values corresponding to each of the fluorophore emission spectral profiles.
-
Sialic Acid Residues, Filamentous Actin, and Nuclear DNA in a Rat Colon Tissue Sample
The rat colon tissue section illustrated in the digital image above was labeled with wheat germ agglutinin (WGA) conjugated to Texas Red. WGA, which selectively binds to N-acetylglucosamine and N-acetylneuraminic (sialic acid) residues, is well suited for staining the Golgi network in fixed cells and tissues since a number of proteins and lipids found in the Golgi apparatus are glycosylated. The specimen was also labeled with Alexa Fluor 488 conjugated to phalloidin (targeting F-actin) and Hoechst 33342 (targeting DNA in the nucleus). Images were recorded in grayscale with a 12-bit digital camera coupled to a Nikon Eclipse 80i microscope equipped with bandpass emission fluorescence filter optical blocks. During the processing stage, individual image channels were pseudocolored with RGB values corresponding to each of the fluorophore emission spectral profiles.
Rat Diaphragm Tissue Sections
The diaphragm divides the chest cavity from the abdominal cavity in mammals through a partition of skeletal muscle and connective tissue. The breastbone and backbone serve as sites of diaphragm attachment as does a centralized aponeurotic tendon. Respiration is heavily dependent on the diaphragm, which is relaxed during exhalation and contracts during inhalation. When relaxed, the diaphragm is arched like a dome and is in close contact with the lungs and heart. In the contractile state, the partition moves downward, facilitating the expansion of the chest and reducing pressure inside of the cavity. In addition to its role in breathing, the diaphragm is involved in digestive processes and waste expulsion.
-
Rat Diaphragm Tissue Section
In the digital image above, a sample of rat diaphragm tissue is presented that was labeled with the fluorophore Oregon Green 488 conjugated to wheat germ agglutinin, a fluorescent lectin that selectively binds to sialic acid residues. Wheat germ agglutinin conjugates are often used as probes for the Golgi network in mammalian tissues and cells. The sample was also stained with Alexa Fluor 568 conjugated to phalloidin and Hoechst 33342, which target F-actin and DNA, respectively. Images were recorded in grayscale with a 12-bit digital camera coupled to a Nikon Eclipse 80i microscope equipped with bandpass emission fluorescence filter optical blocks. During the processing stage, individual image channels were pseudocolored with RGB values corresponding to each of the fluorophore emission spectral profiles.
Rat Duodenum Tissue Sections
Three major regions comprise the small intestine: the duodenum, jejunum, and ileum. The region closest to the stomach is the duodenum, which is separated from that structure by the pyloric sphincter. Once matter is passed from the stomach to the duodenum, it is exposed to bile and digestive juices. These substances, which aid in food digestion, are released into duodenum via the hepatopancreatic duct. Movement of the bolus through the duodenum and other parts of the small intestine is driven by peristalsis, wavelike muscular contractions.
-
Rat Duodenum Tissue Section
In order to localize a red fluorescent tag to filamentous actin in the sample of rat duodenum tissue presented in the digital image above, the specimen was labeled with Alexa Fluor 568 conjugated to phalloidin, a phallotoxin derived from the toxic death cap mushroom. Oregon Green 488 conjugated to the lectin wheat germ agglutinin, which selectively binds to N-acetylglucosamine and N-acetylneuraminic residues, was also applied to the tissue sample, as was the DNA probe Hoechst 33342. Images were recorded in grayscale with a 12-bit digital camera coupled to a Nikon Eclipse 80i microscope equipped with bandpass emission fluorescence filter optical blocks. During the processing stage, individual image channels were pseudocolored with RGB values corresponding to each of the fluorophore emission spectral profiles.
-
Targeting Lectins and The Filamentous Actin Network in Rat Duodenum Tissue Sections
The rat duodenum tissue section illustrated in the digital image above was labeled with wheat germ agglutinin (WGA) conjugated to Oregon Green 488. WGA, which selectively binds to N-acetylglucosamine and N-acetylneuraminic (sialic acid) residues, is well suited for staining the Golgi network in fixed cells and tissues since a number of proteins and lipids found in the Golgi apparatus are glycosylated. The specimen was also labeled with Alexa Fluor 568 conjugated to phalloidin (targeting filamentous actin) and Hoechst 33342 (targeting DNA in the nucleus). Images were recorded in grayscale with a 12-bit digital camera coupled to a Nikon Eclipse 80i microscope equipped with bandpass emission fluorescence filter optical blocks. During the processing stage, individual image channels were pseudocolored with RGB values corresponding to each of the fluorophore emission spectral profiles.
Rat Epididymis Tissue Sections
The reproductive systems of mammalian males contain a component called the epididymis. A narrow, coiled tube connecting each testicle to the corresponding vas deferens, the epididymis serves as a transportation tract and storage site for sperm. Male gametes are immature and incapable of egg fertilization when they leave the testes, but as sperm travel the length of the epididymis they mature, becoming capable of motility and achieving fertility. The maturation process is not completed, however, unless the reproductive cells enter the reproductive tract of a female.
-
Rat Epididymis Tissue Section
In the digital image above, a rat epididymis tissue section is presented that was labeled with the fluorophore Texas Red conjugated to wheat germ agglutinin, a fluorescent lectin that selectively binds to sialic acid residues. Wheat germ agglutinin conjugates are often used as probes for the Golgi network in mammalian tissues and cells. The sample was also stained with Alexa Fluor 488 conjugated to phalloidin and Hoechst 33342, which target filamentous actin and nuclear DNA, respectively. Images were recorded in grayscale with a 12-bit digital camera coupled to a Nikon Eclipse 80i microscope equipped with bandpass emission fluorescence filter optical blocks. During the processing stage, individual image channels were pseudocolored with RGB values corresponding to each of the fluorophore emission spectral profiles.
-
Labeling Epididymis Tissue with Fluorescent Probes Conjugated to Phallotoxins and Lectins
The rat epididymis tissue section illustrated in the digital image above was stained with Texas Red conjugated to wheat germ agglutinin, a plant-derived lectin that targets the Golgi apparatus, as well as Alexa Fluor 488 conjugated to phalloidin for cytoskeletal actin. Nuclei were labeled with Hoechst 33342. Images were recorded in grayscale with a 12-bit digital camera coupled to a Nikon Eclipse 80i microscope equipped with bandpass emission fluorescence filter optical blocks. During the processing stage, individual image channels were pseudocolored with RGB values corresponding to each of the fluorophore emission spectral profiles.
-
Rat Epididymis Tissue Section Triple Stained for F-Actin, Sialic Acid Residues, and DNA
In order to localize a green fluorescent tag to filamentous actin in the sample of rat epididymis tissue presented in the digital image above, the specimen was labeled with Alexa Fluor 488 conjugated to phalloidin, a phallotoxin derived from the toxic death cap mushroom. Texas Red conjugated to the lectin wheat germ agglutinin, which selectively binds to N-acetylglucosamine and N-acetylneuraminic residues, was also applied to the tissue sample, as was the DNA probe Hoechst 33342. Images were recorded in grayscale with a 12-bit digital camera coupled to a Nikon Eclipse 80i microscope equipped with bandpass emission fluorescence filter optical blocks. During the processing stage, individual image channels were pseudocolored with RGB values corresponding to each of the fluorophore emission spectral profiles.
Rat Esophagus Tissue Sections
A component of vertebrate digestive systems, the tubular esophagus moves food from the throat to the stomach. In mammalian species, the esophagus extends from the pharynx to the stomach. The role of this part of the alimentary canal is to serve as a conduit for food taken into the body. Wavelike contractions (known as peristalsis) of the esophageal wall force the food along length of the muscular tube. Mucus glands located in the wall help lubricate the food and ease its movement along the provided path.
-
Rat Esophagus Tissue Section
The rat esophagus tissue section illustrated in the digital image above was stained with Texas Red conjugated to wheat germ agglutinin, a plant-derived lectin that targets the Golgi apparatus, as well as Alexa Fluor 488 conjugated to phalloidin for cytoskeletal actin. Nuclei were labeled with Hoechst 33342. Images were recorded in grayscale with a 12-bit digital camera coupled to a Nikon Eclipse 80i microscope equipped with bandpass emission fluorescence filter optical blocks. During the processing stage, individual image channels were pseudocolored with RGB values corresponding to each of the fluorophore emission spectral profiles.
-
Rat Esophagus Tissue Section Labeled with Wheat Germ Agglutinin and Phalloidin Conjugates
In the digital image above, a rat esophagus tissue section is presented that was labeled with the fluorophore Oregon Green 488 conjugated to wheat germ agglutinin, a fluorescent lectin that selectively binds to sialic acid residues. Wheat germ agglutinin conjugates are often used as probes for the Golgi network in mammalian tissues and cells. The sample was also stained with Alexa Fluor 568 conjugated to phalloidin and Hoechst 33342, which target the cytoskeletal filamentous actin network and nuclear DNA, respectively. Images were recorded in grayscale with a 12-bit digital camera coupled to a Nikon Eclipse 80i microscope equipped with bandpass emission fluorescence filter optical blocks. During the processing stage, individual image channels were pseudocolored with RGB values corresponding to each of the fluorophore emission spectral profiles.
-
Lectin Carbohydrates and Filamentous Actin Visualized in a Rat Colon Sample
The rat esophagus tissue section illustrated in the digital image above was labeled with wheat germ agglutinin (WGA) conjugated to Oregon Green 488. WGA, which selectively binds to N-acetylglucosamine and N-acetylneuraminic (sialic acid) residues, is well suited for staining the Golgi network in fixed cells and tissues since a number of proteins and lipids found in the Golgi apparatus are glycosylated. The specimen was also labeled with Alexa Fluor 568 conjugated to phalloidin (targeting filamentous actin) and Hoechst 33342 (targeting DNA in the nucleus). Images were recorded in grayscale with a 12-bit digital camera coupled to a Nikon Eclipse 80i microscope equipped with bandpass emission fluorescence filter optical blocks. During the processing stage, individual image channels were pseudocolored with RGB values corresponding to each of the fluorophore emission spectral profiles.
Rat Heart Muscle Tissue Sections
Cardiac muscle comprises most of the mammalian heart, which also contains nerves, blood vessels, and valves. Cardiac muscle is striated in appearance, but unlike other striated muscle, controls an involuntary activity, the pumping of the heart. The rhythmic contraction of the heart muscle pushes blood through its chambers and into the connecting blood vessels. Oxygenated blood is transported away from the heart to other regions of the body via arteries, while veins are responsible for carrying oxygen-depleted blood to the organ. The sinoatrial node, commonly referred to as the pacemaker, controls the rhythm of the heart.
-
Rat Heart Muscle Tissue
The sample of rat heart tissue presented in the digital image above was labeled with Tetramethylrhodamine conjugated to wheat germ agglutinin, a lectin that selectively binds to N-acetylglucosamine and sialic acid residues, and with Alexa Fluor 488 conjugated to phalloidin, a phallotoxin that binds filamentous actin. The specimen was counterstained for nuclear DNA with 4',6-diamidino-2-phenylindole (DAPI). Images were recorded in grayscale with a 12-bit digital camera coupled to either a Nikon E-600 or Eclipse 80i microscope equipped with bandpass emission fluorescence filter optical blocks. During the processing stage, individual image channels were pseudocolored with RGB values corresponding to each of the fluorophore emission spectral profiles.
-
Rat Heart Tissue Labeled with Alexa Fluor 568 Conjugated to a Phallotoxin and Wheat Germ Agglutinin
In order to localize a red fluorescent tag to F-actin in the sample of rat heart tissue presented in the digital image above, the specimen was labeled with Alexa Fluor 568 conjugated to a phallotoxin (phalloidin). Oregon Green 488 conjugated to the lectin wheat germ agglutinin, which selectively binds to N-acetylglucosamine and N-acetylneuraminic residues, was also applied to the tissue sample, as was the nuclear counterstain Hoechst 33342. Images were recorded in grayscale with a 12-bit digital camera coupled to a Nikon Eclipse 80i microscope equipped with bandpass emission fluorescence filter optical blocks. During the processing stage, individual image channels were pseudocolored with RGB values corresponding to each of the fluorophore emission spectral profiles.
Rat Ileum Tissue Sections
The last section of the small intestine is the ileum, which is divided from the large intestine by the ileocecal valve. The inner surface of the ileum is covered with small finger-like appendages known as villi. Epithelial cells that line the villi feature numerous microvilli, further increasing the surface area of the ileum. The large surface area of the structure is important for maximizing the adsorption of enzymes and the absorption of nutrients. Enzymes secreted by the epithelial cells are essential for the final steps of carbohydrate and protein digestion. Blood is supplied to the ileum by the superior mesenteric artery and its branches.
-
Rat Ileum Tissue Section
In the digital image above, a sample of rat ileum tissue is presented that was labeled with the fluorophore Texas Red conjugated to wheat germ agglutinin, a fluorescent lectin that selectively binds to sialic acid residues. Wheat germ agglutinin conjugates are often used as probes for the Golgi network in mammalian tissues and cells. The sample was also stained with Alexa Fluor 488 conjugated to phalloidin and Hoechst 33342, which target the cytoskeletal filamentous actin network and nuclear DNA, respectively. Images were recorded in grayscale with a 12-bit digital camera coupled to a Nikon Eclipse 80i microscope equipped with bandpass emission fluorescence filter optical blocks. During the processing stage, individual image channels were pseudocolored with RGB values corresponding to each of the fluorophore emission spectral profiles.
-
Triple Staining of Ileum Section with Alexa Fluor 568, Oregon Green 488, and Hoechst 33342
A rat ileum tissue section (shown above) was stained with Oregon Green 488 conjugated to wheat germ agglutinin, a plant-derived lectin that targets the Golgi apparatus, as well as Alexa Fluor 568 conjugated to phalloidin for cytoskeletal actin. Cell nuclei were labeled with Hoechst 33342. Images were recorded in grayscale with a 12-bit digital camera coupled to a Nikon Eclipse 80i microscope equipped with bandpass emission fluorescence filter optical blocks. During the processing stage, individual image channels were pseudocolored with RGB values corresponding to each of the fluorophore emission spectral profiles.
-
Sialic Acid Residues, F-Actin, and Nuclear DNA in a Rat Ileum Tissue Specimen
In order to localize a green fluorescent tag to filamentous actin in the sample of rat epididymis tissue presented in the digital image above, the specimen was labeled with Alexa Fluor 488 conjugated to phalloidin, a phallotoxin derived from the toxic death cap mushroom. Texas Red conjugated to the lectin wheat germ agglutinin, which selectively binds to N-acetylglucosamine and N-acetylneuraminic residues, was also applied to the tissue sample, as was the DNA probe Hoechst 33342. Images were recorded in grayscale with a 12-bit digital camera coupled to a Nikon Eclipse 80i microscope equipped with bandpass emission fluorescence filter optical blocks. During the processing stage, individual image channels were pseudocolored with RGB values corresponding to each of the fluorophore emission spectral profiles.
Rat Jejunum Tissue Sections
The central region of the small intestine, jejunum connects the duodenum to the ileum. The name of the structure derives from the Latin word jejunus, meaning "empty of food" or "hungry." The term was chosen to reflect the fact that ancient physicians examining bodies after death found this section to be habitually devoid of food. In adult humans, the jejunum is approximately 8 feet long and about one inch in diameter. In order to fit in the abdominal cavity, it winds back and forth in a compact formation, as does the rest of the small intestine.
-
Rat Jejunum Tissue Section
A rat jejunum tissue section (presented above) was stained with Oregon Green 488 conjugated to wheat germ agglutinin, a plant-derived lectin that targets the Golgi apparatus, as well as Alexa Fluor 568 conjugated to phalloidin for cytoskeletal actin. Cell nuclei were labeled with Hoechst 33342. Images were recorded in grayscale with a 12-bit digital camera coupled to a Nikon Eclipse 80i microscope equipped with bandpass emission fluorescence filter optical blocks. During the processing stage, individual image channels were pseudocolored with RGB values corresponding to each of the fluorophore emission spectral profiles.
-
Labeling Rat Jejunum Tissue with Fluorescent Probes Conjugated to Phallotoxins and Lectins
The rat jejunum tissue section illustrated in the digital image above was labeled with wheat germ agglutinin (WGA) conjugated to Oregon Green 488. WGA, which selectively binds to N-acetylglucosamine and N-acetylneuraminic (sialic acid) residues, is well suited for staining the Golgi network in fixed cells and tissues since a number of proteins and lipids found in the Golgi apparatus are glycosylated. The specimen was also labeled with Alexa Fluor 568 conjugated to phalloidin (targeting F-actin) and Hoechst 33342 (targeting DNA in the nucleus). Images were recorded in grayscale with a 12-bit digital camera coupled to a Nikon Eclipse 80i microscope equipped with bandpass emission fluorescence filter optical blocks. During the processing stage, individual image channels were pseudocolored with RGB values corresponding to each of the fluorophore emission spectral profiles.
Rat Lung Tissue Sections
Most vertebrates, except for many fish and a few species of amphibian, utilize lungs for respiration. Air that enters the body through the mouth or nose eventually reaches the lungs after traveling through the trachea and the bronchi. The lungs are highly elastic organs composed of specialized cells that form millions of tiny air sacs termed alveoli. An extensive network of capillaries surrounds the alveoli, which are organized into lobules. Blood passing through the capillaries releases carbon dioxide into the alveoli to be exhaled from the body. Conversely, oxygen inhaled into the lungs diffuses from the alveoli into the bloodstream.
-
Rat Lung Tissue Section
In the digital image above, a sample of rat lung tissue is presented that was labeled with the fluorophore Oregon Green 488 conjugated to wheat germ agglutinin, a fluorescent lectin that selectively binds to sialic acid residues. Wheat germ agglutinin conjugates are often used as probes for the Golgi network in mammalian tissues and cells. The sample was also stained with Alexa Fluor 568 conjugated to phalloidin and Hoechst 33342, which target the cytoskeletal filamentous actin network and nuclear DNA, respectively. Images were recorded in grayscale with a 12-bit digital camera coupled to a Nikon Eclipse 80i microscope equipped with bandpass emission fluorescence filter optical blocks. During the processing stage, individual image channels were pseudocolored with RGB values corresponding to each of the fluorophore emission spectral profiles.
Rat Mammary Gland Tissue Sections
Rats are commonly used as animal models for the characterization of diseases that affect humans and for the evaluation of the effectiveness of potential treatment for those diseases. The rat mammary has been extensively employed in studies of breast cancer, one of the main causes of cancer-related death in women. Breast cancer is a form of cancer that arises in either the exocrine gland system or ducts that comprise the mammary glands. Incidence of breast cancer has been gradually on the rise since the 1970s, but at the same time detection and treatment has improved, resulting in a decline of mortality in recent years. Numerous risk factors for breast cancer have been identified, including a genetic factor associated with a mutated BRCA1 gene.
-
Rat Mammary Gland Tissue Section
The rat mammary gland tissue section illustrated in the digital image above was labeled with wheat germ agglutinin (WGA) conjugated to Oregon Green 488. WGA, which selectively binds to N-acetylglucosamine and N-acetylneuraminic (sialic acid) residues, is often used to target the Golgi network in fixed cells and tissues since a number of proteins and lipids found in the Golgi apparatus are glycosylated. The specimen was also labeled with Alexa Fluor 568 conjugated to phalloidin (targeting F-actin) and Hoechst 33342 (targeting DNA in the nucleus). Images were recorded in grayscale with a 12-bit digital camera coupled to a Nikon Eclipse 80i microscope equipped with bandpass emission fluorescence filter optical blocks. During the processing stage, individual image channels were pseudocolored with RGB values corresponding to each of the fluorophore emission spectral profiles.
Rat Ovary Tissue Sections
As producers and repositories of eggs, ovaries are central to the female vertebrate reproductive system. Homologous to the male testes, the ovaries secrete the female sex hormones estrogen and progesterone, as well as a number of other minor hormones. During embryonic development, the ovaries produce immature eggs, which mature and are released later in life after reproductive maturity has been reached. According to traditional scientific opinion, the eggs female mammals produce before they are born serve as their sole source of eggs throughout their reproductive years. However, recent scientific evidence obtained from studies of rodents suggests that this may not be the case. Whether or not humans can produce additional eggs postnatally is not yet known with certainty.
-
Rat Ovary Tissue Section
A rat ovary tissue section (shown above) was stained with Oregon Green 488 conjugated to wheat germ agglutinin, a plant-derived lectin that targets the Golgi apparatus, as well as Alexa Fluor 568 conjugated to phalloidin for cytoskeletal actin. Cell nuclei were labeled with Hoechst 33342. Images were recorded in grayscale with a 12-bit digital camera coupled to a Nikon Eclipse 80i microscope equipped with bandpass emission fluorescence filter optical blocks. During the processing stage, individual image channels were pseudocolored with RGB values corresponding to each of the fluorophore emission spectral profiles.
Rat Oviduct Tissue Sections
After leaving the ovaries, eggs travel through tubular oviducts to the uterus or to the outside of the body from the ovaries in egg-producing female animals. In humans, they are commonly referred to as fallopian tubes. The internal environment provided by the oviducts is conducive to fertilization of ova and the first stages of conceptus development. An egg enters an oviduct at the broad portion of the tube known as the infundibulum and moves along the tube with the help of the ciliated epithelium that lines it. The cilia beat with a wavelike motion, propelling a released ovum toward the uterus. When an egg is unfertilized, it typically degenerates in the ampulla, the mid-region of the fallopian tube. A fertilized egg will continue along the path, which terminates in the isthmus, the final portion of the oviduct before reaching the uterus.
-
Rat Oviduct Tissue Section
In order to localize a green fluorescent tag to F-actin in the sample of rat oviduct tissue presented in the digital image above, the specimen was labeled with Alexa Fluor 488 conjugated to phalloidin, a phallotoxin derived from the toxic death cap mushroom. Texas Red conjugated to the lectin wheat germ agglutinin, which selectively binds to N-acetylglucosamine and N-acetylneuraminic residues, was also applied to the tissue sample, as was the DNA probe Hoechst 33342. Images were recorded in grayscale with a 12-bit digital camera coupled to a Nikon Eclipse 80i microscope equipped with bandpass emission fluorescence filter optical blocks. During the processing stage, individual image channels were pseudocolored with RGB values corresponding to each of the fluorophore emission spectral profiles.
Rat Placenta Tissue Sections
A temporary structure found only in pregnant females of higher mammalian species, the placenta develops in the uterus and is attached to it until shortly after childbirth. The placenta is also connected to the fetus via the umbilical cord. Placental vasculature is extensive and enables the ready transfer of oxygen and nutrients to the fetus from the mother's circulatory system, as well as the disposal of fetal waste products. The placenta serves as a barrier to many harmful materials, providing a certain amount of protection to the fetus. Alcohol and most viruses are not successfully filtered out by the placenta and can be extremely detrimental to fetal development. The placenta also functions in a glandular and metabolic capacity. A number of different hormones are secreted by the organ, including progesterone, gonadotrophin, and estrogen.
-
Rat Placenta Tissue Section
The rat placenta tissue section illustrated in the digital image above was labeled with wheat germ agglutinin (WGA) conjugated to Texas Red. WGA, which selectively binds to N-acetylglucosamine and N-acetylneuraminic (sialic acid) residues, is often used to target the Golgi network in fixed cells and tissues. The specimen was also labeled with Alexa Fluor 488 conjugated to phalloidin (targeting F-actin) and Hoechst 33342 (targeting DNA in the nucleus). Images were recorded in grayscale with a 12-bit digital camera coupled to a Nikon Eclipse 80i microscope equipped with bandpass emission fluorescence filter optical blocks. During the processing stage, individual image channels were pseudocolored with RGB values corresponding to each of the fluorophore emission spectral profiles.
-
Rat Placenta Tissue Sample with Alexa Fluor 488, Texas Red, and Hoechst 33342
A rat placenta tissue section (presented above) was stained with Texas Red conjugated to wheat germ agglutinin, a plant-derived lectin that targets the Golgi apparatus, as well as Alexa Fluor 488 conjugated to phalloidin for cytoskeletal actin. Cell nuclei were labeled with Hoechst 33342. Images were recorded in grayscale with a 12-bit digital camera coupled to a Nikon Eclipse 80i microscope equipped with bandpass emission fluorescence filter optical blocks. During the processing stage, individual image channels were pseudocolored with RGB values corresponding to each of the fluorophore emission spectral profiles.
Rat Rectal Tissue Sections
In rats and other vertebrates, the large intestine contains three sections: the cecum, colon, and rectum. The terminal portion of the organ is the rectum, which extends from the sigmoid flexure (an S-shaped portion of the colon) to the anal canal. Compared to many other parts of the alimentary canal, the rectum, with a length of only about 5 inches in the adult human, is quite short. Thus it does not wind back in forth in the body as do the intestines, but stretches simply in a straight line toward the anal sphincter.
-
Rat Rectum Tissue Section
The sample of rat rectum tissue featured in the digital image above was labeled with Texas Red conjugated to wheat germ agglutinin, a lectin that selectively binds to sialic acid residues found in both mucoproteins and glycoproteins. The cells were also stained with Alexa Fluor 488 conjugated to phalloidin and the dye Hoechst 33342, which target the cytoskeletal filamentous actin network and nuclear DNA, respectively. Images were recorded in grayscale with a 12-bit digital camera coupled to a Nikon Eclipse 80i microscope equipped with bandpass emission fluorescence filter optical blocks. During the processing stage, individual image channels were pseudocolored with RGB values corresponding to each of the fluorophore emission spectral profiles.
-
Labeling Rectal Tissue with Fluorescent Probes Conjugated to Phallotoxins and Lectins
In order to localize a red fluorescent tag to F-actin in the sample of rat rectum tissue presented in the digital image above, the specimen was labeled with Alexa Fluor 568 conjugated to phalloidin, a phallotoxin derived from the toxic death cap mushroom. Oregon Green 488 conjugated to the lectin wheat germ agglutinin, which selectively binds to N-acetylglucosamine and N-acetylneuraminic residues, was also applied to the tissue sample, as was the DNA probe Hoechst 33342. Images were recorded in grayscale with a 12-bit digital camera coupled to a Nikon Eclipse 80i microscope equipped with bandpass emission fluorescence filter optical blocks. During the processing stage, individual image channels were pseudocolored with RGB values corresponding to each of the fluorophore emission spectral profiles.
-
Rat Rectum Tissue Section Triple Stained for the Golgi Network, F-Actin, and Nuclei
A rat rectum tissue section (presented above) was stained with Oregon Green 488 conjugated to wheat germ agglutinin in order to target the Golgi apparatus. In addition, the cytoskeletal filamentous actin network was labeled with Alexa Fluor 568 conjugated to phalloidin and cell nuclei were stained with Hoechst 33342. Images were recorded in grayscale with a 12-bit digital camera coupled to a Nikon Eclipse 80i microscope equipped with bandpass emission fluorescence filter optical blocks. During the processing stage, individual image channels were pseudocolored with RGB values corresponding to each of the fluorophore emission spectral profiles.
-
Rat Rectal Tissue Sample Labeled with Alexa Fluor 488, Texas Red, and Hoechst 33342
In the digital image above, a sample of rat rectum tissue is presented that was labeled with the fluorophore Texas Red conjugated to wheat germ agglutinin, a fluorescent lectin that selectively binds to sialic acid residues. Wheat germ agglutinin conjugates are often used as probes for the Golgi network in mammalian tissues and cells. The sample was also stained with Alexa Fluor 488 conjugated to phalloidin and Hoechst 33342, which target the cytoskeletal filamentous actin network and nuclear DNA, respectively. Images were recorded in grayscale with a 12-bit digital camera coupled to a Nikon Eclipse 80i microscope equipped with bandpass emission fluorescence filter optical blocks. During the processing stage, individual image channels were pseudocolored with RGB values corresponding to each of the fluorophore emission spectral profiles.
-
Visualizing Golgi Complexes and Filamentous Actin in Rectal Tissue
A rat rectum tissue section (shown above) was stained with Texas Red conjugated to wheat germ agglutinin, a plant-derived lectin that targets the Golgi apparatus, as well as Alexa Fluor 488 conjugated to phalloidin for cytoskeletal actin. Cell nuclei were labeled with Hoechst 33342. Images were recorded in grayscale with a 12-bit digital camera coupled to a Nikon Eclipse 80i microscope equipped with bandpass emission fluorescence filter optical blocks. During the processing stage, individual image channels were pseudocolored with RGB values corresponding to each of the fluorophore emission spectral profiles.
-
Sialic Acid Residues, Filamentous Actin, and Nuclear DNA in a Rat Rectum Tissue Sample
In order to localize a green fluorescent tag to F-actin in the sample of rat rectum tissue presented in the digital image above, the specimen was labeled with Alexa Fluor 488 conjugated to phalloidin, a cyclic peptide derived from the toxic death cap fungus (Amanita phalloides). Texas Red conjugated to the lectin wheat germ agglutinin, which selectively binds to N-acetylglucosamine and N-acetylneuraminic residues, was also applied to the tissue sample, as was the nuclear counterstain Hoechst 33342. Images were recorded in grayscale with a 12-bit digital camera coupled to a Nikon Eclipse 80i microscope equipped with bandpass emission fluorescence filter optical blocks. During the processing stage, individual image channels were pseudocolored with RGB values corresponding to each of the fluorophore emission spectral profiles.
-
Rat Rectum Tissue Labeled with Oregon Green 488
The rat rectum tissue section presented in the digital image above was labeled with Oregon Green 488 conjugated to the lectin wheat germ agglutinin. Fluorescent wheat germ agglutinin conjugates are often used as probes for the Golgi network in mammalian cultures and tissue samples. The tissue section was also stained with Alexa Fluor 568 conjugated to phalloidin and Hoechst 33342, which target F-actin and DNA, respectively. Images were recorded in grayscale with a 12-bit digital camera coupled to a Nikon Eclipse 80i microscope equipped with bandpass emission fluorescence filter optical blocks. During the processing stage, individual image channels were pseudocolored with RGB values corresponding to each of the fluorophore emission spectral profiles.
Rat Seminal Vesicle Tissue Sections
The seminal vesicles are paired sac-like glands in the male reproductive system. Positioned at the base of the bladder, the vesicles empty into the ejaculatory duct that leads into the urethra. The primary function of the seminal vesicles is to secrete much of the fluid that carries sperm. In humans, approximately 60 percent of seminal fluid is released by the vesicles, though this varies among mammalian species. The prostate gland is responsible for secreting most of the remainder of the fluid, which combines with mucus produced by the Cowper's glands to form semen.
-
Rat Seminal Vesicle Tissue Section
The cytoskeletal filamentous actin network was targeted in a rat seminal vesicle tissue sample with phalloidin conjugated to Alexa Fluor 568. Phalloidin is a member of the phallotoxin group of bicyclic peptides isolated from the deadly Amanita phalloides mushroom. The tissue section was also labeled for nuclear DNA with Hoechst 33342. Images were recorded in grayscale with a 12-bit digital camera coupled to a Nikon Eclipse 80i microscope equipped with bandpass emission fluorescence filter optical blocks. During the processing stage, individual image channels were pseudocolored with RGB values corresponding to each of the fluorophore emission spectral profiles.
-
Rat Seminal Vesicle Tissue Section Triple Stained for the Golgi Network, F-Actin, and Nuclei
In the digital image above, a sample of rat seminal vesicle tissue is presented that was labeled with the fluorophore Oregon Green 488 conjugated to wheat germ agglutinin, a lectin that selectively binds to sialic acid residues. Wheat germ agglutinin conjugates are often used as probes for the Golgi network in mammalian tissues and cells. The sample was also stained with Alexa Fluor 568 conjugated to phalloidin and Hoechst 33342, which target the cytoskeletal F-actin network and nuclear DNA, respectively. Images were recorded in grayscale with a 12-bit digital camera coupled to a Nikon Eclipse 80i microscope equipped with bandpass emission fluorescence filter optical blocks. During the processing stage, individual image channels were pseudocolored with RGB values corresponding to each of the fluorophore emission spectral profiles.
Rat Skeletal Muscle Tissue Sections
Skeletal muscle exhibits an alternating light and dark striped appearance when viewed under a light microscope and is, consequently, often referred to as striated muscle. This type of muscle is typically under conscious control and comprises the majority of the body's muscle mass. Linked to the skeletal system, skeletal muscle also provides the basic shape of the body. The dark regions of skeletal muscle consist of Type I fibers, which employ oxidative metabolism and are especially adapted for activities that require endurance. The light regions are composed of Type II fibers that tire much faster but are useful for activities necessitating spurts of power or speed. Type II fibers utilize anaerobic metabolism rather than oxidative metabolism.
-
Rat Skeletal Muscle Tissue Labeled with Wheat Germ Agglutinin and Phalloidin
In order to localize a red fluorescent tag to F-actin in the sample of rat skeletal muscle tissue presented in the digital image above, the specimen was labeled with Alexa Fluor 568 conjugated to a phallotoxin (phalloidin). Oregon Green 488 conjugated to the lectin wheat germ agglutinin, which selectively binds to N-acetylglucosamine and N-acetylneuraminic residues, was also applied to the tissue sample, as was the nuclear counterstain Hoechst 33342. Images were recorded in grayscale with a 12-bit digital camera coupled to a Nikon Eclipse 80i microscope equipped with bandpass emission fluorescence filter optical blocks. During the processing stage, individual image channels were pseudocolored with RGB values corresponding to each of the fluorophore emission spectral profiles.
-
Rat Skeletal Muscle Tissue Labeled with Wheat Germ Agglutinin and Phalloidin
This widefield image of a rat skeletal muscle tissue section was produced by probing the specimen with Alexa Fluor 568, Oregon Green 488, and Hoechst 33342. The Alexa Fluor dye was conjugated to phalloidin, targeting the cytoskeletal F-actin network, and Oregon Green 488 was conjugated to WGA in order to localize a green fluorescent tag to the Golgi complex. The nuclear counterstain Hoechst 33342 was employed to visualize cell nuclei. Images were recorded in grayscale with a 12-bit digital camera coupled to a Nikon Eclipse 80i microscope equipped with bandpass emission fluorescence filter optical blocks. During the processing stage, individual image channels were pseudocolored with RGB values corresponding to each of the fluorophore emission spectral profiles.
Rat Stomach Tissue Sections
Due to the design of the rodent digestive system, most rodents must consume their food twice before nutrients can be efficiently absorbed. When food is initially imbibed by a rodent, it is softened in the stomach and is carried to the small intestine and then a large, post-digestive cecum that houses a dense collection of bacteria. The activity of the bacteria is breaks down cellulose molecules into simple starches and sugars, but once the material has reached the part of the digestive tract in which the bacterial flora is located, it is past the point where it can be absorbed into the body. In order to obtain nutrients that would be otherwise lost, the rodent reingests the fecal pellets it produces.
-
Rat Stomach Tissue Section
The cytoskeletal F-actin network was targeted in a sample of the pylorus region of a rat stomach (presented above) with phalloidin conjugated to Alexa Fluor 488. Phalloidin is a member of the phallotoxin group of bicyclic peptides isolated from the deadly Amanita phalloides mushroom. The tissue section was also labeled for nuclear DNA with Hoechst 33342 and the Golgi complex with Texas Red conjugated to wheat germ agglutinin (WGA). Images were recorded in grayscale with a 12-bit digital camera coupled to a Nikon Eclipse 80i microscope equipped with bandpass emission fluorescence filter optical blocks. During the processing stage, individual image channels were pseudocolored with RGB values corresponding to each of the fluorophore emission spectral profiles.
-
Section of Rat Pylorus Skeletal Muscle Tissue Labeled with Wheat Germ Agglutinin and Phalloidin
The cytoskeletal filamentous actin network was targeted in a rat stomach tissue sample (presented above) with phalloidin conjugated to Alexa Fluor 568. Phalloidin is a member of the phallotoxin group of bicyclic peptides isolated from the deadly Amanita phalloides mushroom. The tissue section was also labeled for nuclear DNA with Hoechst 33342 and the Golgi complex with Oregon Green 488 conjugated to wheat germ agglutinin (WGA). Images were recorded in grayscale with a 12-bit digital camera coupled to a Nikon Eclipse 80i microscope equipped with bandpass emission fluorescence filter optical blocks. During the processing stage, individual image channels were pseudocolored with RGB values corresponding to each of the fluorophore emission spectral profiles.
-
Localizing Fluorescent Tags to the Golgi Complex and the F-Actin Cytoskeleton in Rat Stomach Samples
This widefield image of a rat stomach tissue section was produced by probing the specimen with Alexa Fluor 488, Texas Red, and Hoechst 33342. The Alexa Fluor dye was conjugated to phalloidin, targeting the cytoskeletal F-actin network, and Texas Red was conjugated to WGA in order to localize a red fluorescent tag to the Golgi complex. The nuclear counterstain Hoechst 33342 was employed to visualize cell nuclei. Images were recorded in grayscale with a 12-bit digital camera coupled to a Nikon Eclipse 80i microscope equipped with bandpass emission fluorescence filter optical blocks. During the processing stage, individual image channels were pseudocolored with RGB values corresponding to each of the fluorophore emission spectral profiles.
-
Pylorus Region of Rat Stomach with Alexa Fluor 488, Texas Red, and Hoechst 33342
The sample of rat stomach tissue featured in the digital image above was labeled with Texas Red conjugated to wheat germ agglutinin, a lectin that selectively binds to sialic acid residues found in both mucoproteins and glycoproteins. The cells were also stained with Alexa Fluor 488 conjugated to phalloidin and the dye Hoechst 33342, which target the cytoskeletal filamentous actin network and nuclear DNA, respectively. Images were recorded in grayscale with a 12-bit digital camera coupled to a Nikon Eclipse 80i microscope equipped with bandpass emission fluorescence filter optical blocks. During the processing stage, individual image channels were pseudocolored with RGB values corresponding to each of the fluorophore emission spectral profiles.
-
Sialic Acid Residues, Filamentous Actin, and Nuclear DNA in Rat Fundus Tissue
In order to localize a red fluorescent tag to F-actin in the sample of rat stomach tissue presented in the digital image above, the specimen was labeled with Alexa Fluor 568 conjugated to a phallotoxin (phalloidin). Oregon Green 488 conjugated to the lectin wheat germ agglutinin, which selectively binds to N-acetylglucosamine and N-acetylneuraminic residues, was also applied to the tissue sample, as was the nuclear counterstain Hoechst 33342. Images were recorded in grayscale with a 12-bit digital camera coupled to a Nikon Eclipse 80i microscope equipped with bandpass emission fluorescence filter optical blocks. During the processing stage, individual image channels were pseudocolored with RGB values corresponding to each of the fluorophore emission spectral profiles.
-
Rat Stomach Fundus Region Tissue Section Labeled with Fluorescent Probes Conjugated to Phallotoxins and Lectins
This widefield image of a rat stomach tissue section was produced by probing the specimen with Alexa Fluor 568, Oregon Green 488, and Hoechst 33342. The Alexa Fluor dye was conjugated to phalloidin, targeting the cytoskeletal filamentous actin network, and Oregon Green 488 was conjugated to WGA in order to label the Golgi complex. Cell nuclei were visualized with Hoechst 33342. Images were recorded in grayscale with a 12-bit digital camera coupled to a Nikon Eclipse 80i microscope equipped with bandpass emission fluorescence filter optical blocks. During the processing stage, individual image channels were pseudocolored with RGB values corresponding to each of the fluorophore emission spectral profiles.
-
Triple Staining of Stomach Tissue Sample with Alexa Fluor 568, Oregon Green 488, and Hoechst 33342
The cytoskeletal F-actin network was targeted in a sample of the fundus region of a rat stomach (presented above) with phalloidin conjugated to Alexa Fluor 568. Phalloidin is a member of the phallotoxin group of bicyclic peptides isolated from the deadly Amanita phalloides mushroom. The tissue section was also labeled for nuclear DNA with Hoechst 33342 and the Golgi complex with Oregon Green 488 conjugated to wheat germ agglutinin (WGA). Images were recorded in grayscale with a 12-bit digital camera coupled to a Nikon Eclipse 80i microscope equipped with bandpass emission fluorescence filter optical blocks. During the processing stage, individual image channels were pseudocolored with RGB values corresponding to each of the fluorophore emission spectral profiles.
-
Targeting Sialic Acid Residues, Filamentous Actin, and Nuclei in Rat Gastric Tissue
The sample of rat stomach tissue featured in the digital image above was labeled with Oregon Green 488 conjugated to wheat germ agglutinin, a lectin that selectively binds to sialic acid residues found in both mucoproteins and glycoproteins. The cells were also stained with Alexa Fluor 568 conjugated to phalloidin and the dye Hoechst 33342, which target the cytoskeletal filamentous actin network and nuclear DNA, respectively. Images were recorded in grayscale with a 12-bit digital camera coupled to a Nikon Eclipse 80i microscope equipped with bandpass emission fluorescence filter optical blocks. During the processing stage, individual image channels were pseudocolored with RGB values corresponding to each of the fluorophore emission spectral profiles.
-
Probing Golgi Networks and Filamentous Actin Networks in a Sample of Rat Stomach Tissue
In the digital image above, a rat stomach tissue section excised from the pylorus region is presented that was labeled with the fluorophore Oregon Green 488 conjugated to wheat germ agglutinin, targeting the Golgi network. The sample was also labeled with Alexa Fluor 568 conjugated to phalloidin and Hoechst 33342, which target filamentous actin and nuclear DNA, respectively. Images were recorded in grayscale with a 12-bit digital camera coupled to a Nikon Eclipse 80i microscope equipped with bandpass emission fluorescence filter optical blocks. During the processing stage, individual image channels were pseudocolored with RGB values corresponding to each of the fluorophore emission spectral profiles.
-
Rat Pylorus Region Labeled with Alexa Fluor 568, Oregon Green 488, and Hoechst 33342
In order to localize a red fluorescent tag to F-actin in the sample of rat stomach tissue presented in the digital image above, the specimen was labeled with Alexa Fluor 568 conjugated to a phallotoxin (phalloidin). Oregon Green 488 conjugated to the lectin wheat germ agglutinin, which selectively binds to N-acetylglucosamine and N-acetylneuraminic residues, was also applied to the tissue sample, as was the nuclear counterstain Hoechst 33342. Images were recorded in grayscale with a 12-bit digital camera coupled to a Nikon Eclipse 80i microscope equipped with bandpass emission fluorescence filter optical blocks. During the processing stage, individual image channels were pseudocolored with RGB values corresponding to each of the fluorophore emission spectral profiles.
-
Localizing Fluorescent Tags to Filamentous Actin and Golgi Complexes in Gastric Tissue
This widefield image of a rat stomach tissue sample was produced by probing the specimen with Alexa Fluor 568, Oregon Green 488, and Hoechst 33342. The Alexa Fluor dye was conjugated to phalloidin, targeting the cytoskeletal F-actin network, and Oregon Green 488 was conjugated to WGA in order to localize a green fluorescent tag to the Golgi complex. The nuclear counterstain Hoechst 33342 was employed to visualize cell nuclei. Images were recorded in grayscale with a 12-bit digital camera coupled to a Nikon Eclipse 80i microscope equipped with bandpass emission fluorescence filter optical blocks. During the processing stage, individual image channels were pseudocolored with RGB values corresponding to each of the fluorophore emission spectral profiles.
-
Rat Stomach Section Treated with Wheat Germ Agglutinin and Phalloidin Conjugates
The section of rat stomach tissue featured in the digital image above was labeled with Oregon Green 488 conjugated to wheat germ agglutinin, a lectin that selectively binds to sialic acid residues found in both mucoproteins and glycoproteins. The cells were also stained with Alexa Fluor 568 conjugated to phalloidin and the dye Hoechst 33342, which target the cytoskeletal filamentous actin network and nuclear DNA, respectively. Images were recorded in grayscale with a 12-bit digital camera coupled to a Nikon Eclipse 80i microscope equipped with bandpass emission fluorescence filter optical blocks. During the processing stage, individual image channels were pseudocolored with RGB values corresponding to each of the fluorophore emission spectral profiles.
-
Labeling Gastric Tissue with Fluorescent Probes Conjugated to Phallotoxins and Lectins
In the digital image above, a rat stomach tissue section excised from the pylorus region is presented that was labeled with the fluorophore Oregon Green 488 conjugated to wheat germ agglutinin, targeting the Golgi network. The sample was also labeled with Alexa Fluor 568 conjugated to phalloidin in order to target filamentous actin and with Hoechst 33342 to counterstain nuclear DNA. Images were recorded in grayscale with a 12-bit digital camera coupled to a Nikon Eclipse 80i microscope equipped with bandpass emission fluorescence filter optical blocks. During the processing stage, individual image channels were pseudocolored with RGB values corresponding to each of the fluorophore emission spectral profiles.
-
Pylorus Tissue Sample Probed with Texas Red, Alexa Fluor 488, and Hoechst 33342
In order to localize a green fluorescent tag to filamentous actin in the sample of rat stomach tissue presented in the digital image above, the specimen was labeled with Alexa Fluor 488 conjugated to a phalloidin. Texas Red conjugated to the lectin wheat germ agglutinin, which selectively binds to N-acetylglucosamine and N-acetylneuraminic residues, was also applied to the tissue sample, as was the nuclear counterstain Hoechst 33342. Images were recorded in grayscale with a 12-bit digital camera coupled to a Nikon Eclipse 80i microscope equipped with bandpass emission fluorescence filter optical blocks. During the processing stage, individual image channels were pseudocolored with RGB values corresponding to each of the fluorophore emission spectral profiles.
-
Stomach Tissue Labeled with Oregon Green 488 Conjugated to Wheat Germ Agglutinin
In the digital image above, a sample of rat stomach tissue is presented that was labeled with the fluorophore Oregon Green 488 conjugated to wheat germ agglutinin, a lectin that selectively binds to sialic acid residues. Wheat germ agglutinin conjugates are often used as probes for the Golgi network in mammalian tissues and cells. The sample was also stained with Alexa Fluor 568 conjugated to phalloidin and Hoechst 33342, which target the cytoskeletal F-actin network and nuclear DNA, respectively. Images were recorded in grayscale with a 12-bit digital camera coupled to a Nikon Eclipse 80i microscope equipped with bandpass emission fluorescence filter optical blocks. During the processing stage, individual image channels were pseudocolored with RGB values corresponding to each of the fluorophore emission spectral profiles.
-
Probing Rat Tissue Sections with Alexa Fluor 488 Conjugated to a Lectin Isolated from the Red Kidney Bean
Alexa Fluor 488 conjugated to a lectin isolated from the red kidney bean (Phaseolus vulgaris) was utilized to target glycoproteins present in the sample of rat stomach tissue depicted in the digital image above (yielding green emission). The specimen was also stained for F-actin and nuclear DNA with Alexa Fluor 568 (red emission) conjugated to phalloidin and Hoechst 33258 (blue emission), respectively. Images were recorded in grayscale with a 12-bit digital camera coupled to either a Nikon E-600 or Eclipse 80i microscope equipped with bandpass emission fluorescence filter optical blocks. During the processing stage, individual image channels were pseudocolored with RGB values corresponding to each of the fluorophore emission spectral profiles.
Rat Thyroid Tissue Sections
Functioning chiefly in metabolism and growth, the thyroid is a major endocrine gland present in craniate vertebrates. In humans, the two connected lobes of follicular tissue that comprise the gland are located on either side of the trachea, but the gland is positioned differently in various other species. The thyroid gland secretes thyroxine, a hormone that regulates the oxidation rate of cells and contains a large amount of iodine. Insufficient iodine in the diet can interfere with the production of thyroxine, resulting in hypothyroidism, which is distinguished by swelling of the thyroid and neck known as goiter. Hypothyroidism of this type has been virtually eliminated by the widespread use of iodized salt. The condition may also develop, however, due to problems with glandular function, in which case it is most commonly referred to as either cretinism (childhood form) or myxedema (adult form). Studies of the rat thyroid have been critical in developing a better understanding of these and other thyroid diseases.
-
Rat Thyroid Tissue Section
The section of rat thyroid tissue featured in the digital image above was labeled with Oregon Green 488 conjugated to wheat germ agglutinin, a lectin that selectively binds to sialic acid residues found in both mucoproteins and glycoproteins. The cells were also stained with Alexa Fluor 568 conjugated to phalloidin and the dye Hoechst 33342, which target the cytoskeletal filamentous actin network and nuclear DNA, respectively. Images were recorded in grayscale with a 12-bit digital camera coupled to a Nikon Eclipse 80i microscope equipped with bandpass emission fluorescence filter optical blocks. During the processing stage, individual image channels were pseudocolored with RGB values corresponding to each of the fluorophore emission spectral profiles.
Rat Vagina Tissue Sections
Highly elastic and muscular, the tube-like vagina links the cervix to the vulva in the female reproductive system. In humans, the vagina is usually approximately four inches long and one inch in diameter. The size and shape of the vagina changes significantly during childbirth in order to accommodate the fetus as it is being delivered. At this time, the vagina is often called the birth canal. No glands are present in the vaginal wall, but secretions are produced by glands located near the opening of the organ.
-
Rat Vagina Tissue Section
In the digital image above, a section of rat vagina tissue is presented that was labeled with the fluorophore Oregon Green 488 conjugated to wheat germ agglutinin, targeting the Golgi network. The sample was also labeled with Alexa Fluor 568 conjugated to phalloidin in order to target filamentous actin and with Hoechst 33342 to counterstain nuclear DNA. Images were recorded in grayscale with a 12-bit digital camera coupled to a Nikon Eclipse 80i microscope equipped with bandpass emission fluorescence filter optical blocks. During the processing stage, individual image channels were pseudocolored with RGB values corresponding to each of the fluorophore emission spectral profiles.
-
Localizing Fluorescent Tags to F-Actin and Golgi Complexes in Rat Vagina Tissue Sections
The cytoskeletal F-actin network was targeted in a sample of rat vagina tissue (presented above) with phalloidin conjugated to Alexa Fluor 568. Phalloidin is a member of the phallotoxin group of bicyclic peptides isolated from the toxic Amanita phalloides mushroom. The tissue section was also labeled for nuclear DNA with Hoechst 33342 and the Golgi complex with Oregon Green 488 conjugated to wheat germ agglutinin (WGA). Images were recorded in grayscale with a 12-bit digital camera coupled to a Nikon Eclipse 80i microscope equipped with bandpass emission fluorescence filter optical blocks. During the processing stage, individual image channels were pseudocolored with RGB values corresponding to each of the fluorophore emission spectral profiles.
-
Rat Vagina Tissue Labeled with Alexa Fluor 568, Oregon Green 488, and Hoechst 33342
In order to localize a red fluorescent tag to filamentous actin in the sample of rat vagina tissue presented in the digital image above, the specimen was labeled with Alexa Fluor 568 conjugated to a phalloidin. Oregon Green 488 conjugated to the lectin wheat germ agglutinin, which selectively binds to N-acetylglucosamine and N-acetylneuraminic residues, was also applied to the tissue sample, as was the nuclear counterstain Hoechst 33342. Images were recorded in grayscale with a 12-bit digital camera coupled to a Nikon Eclipse 80i microscope equipped with bandpass emission fluorescence filter optical blocks. During the processing stage, individual image channels were pseudocolored with RGB values corresponding to each of the fluorophore emission spectral profiles.